YCC CAPITAL
Emerging Markets & China Strategy
June 21, 2026
YCC Perspective
For much of the past two decades, China’s property market functioned as both an economic engine and a household wealth creation machine. For many families, purchasing an apartment was not merely a housing decision—it was a milestone marking upward mobility, financial security, and participation in China’s growth story.
Today, the industry finds itself in a very different phase. The question is no longer whether the sector is contracting. That adjustment is already well underway. The more important question is whether the industry is transitioning from a liquidity crisis toward a balance-sheet repair cycle that can ultimately restore sustainable growth.
To answer that question, we examined the 2025 annual reports of 152 listed Chinese property developers across A-share and Hong Kong markets. The findings suggest that while systemic risks continue to decline and debt restructuring is making meaningful progress, operational fundamentals remain fragile. The industry is stabilizing—but it is not yet healthy.
This report is based on financial data and analysis contained in the underlying industry research covering 152 listed Chinese developers.
Executive Summary
The central message from 2025 financial statements is straightforward:
The Good News
- Industry leverage continues to decline.
- Debt restructuring has accelerated.
- Large-scale systemic financial risks are gradually easing.
- High-risk developers are reducing liabilities.
- Debt structures are becoming more long-term and standardized.
The Bad News
- Revenue continues to fall.
- Profitability remains deeply impaired.
- Cash flow remains negative for a fifth consecutive year.
- Housing demand recovery remains uneven.
- Lower-tier cities continue to struggle with excess inventory.
- Private developers remain largely shut out of capital markets.
In short, China’s property sector has moved from the acute phase of crisis into a prolonged phase of rehabilitation.
The State of Developer Operations
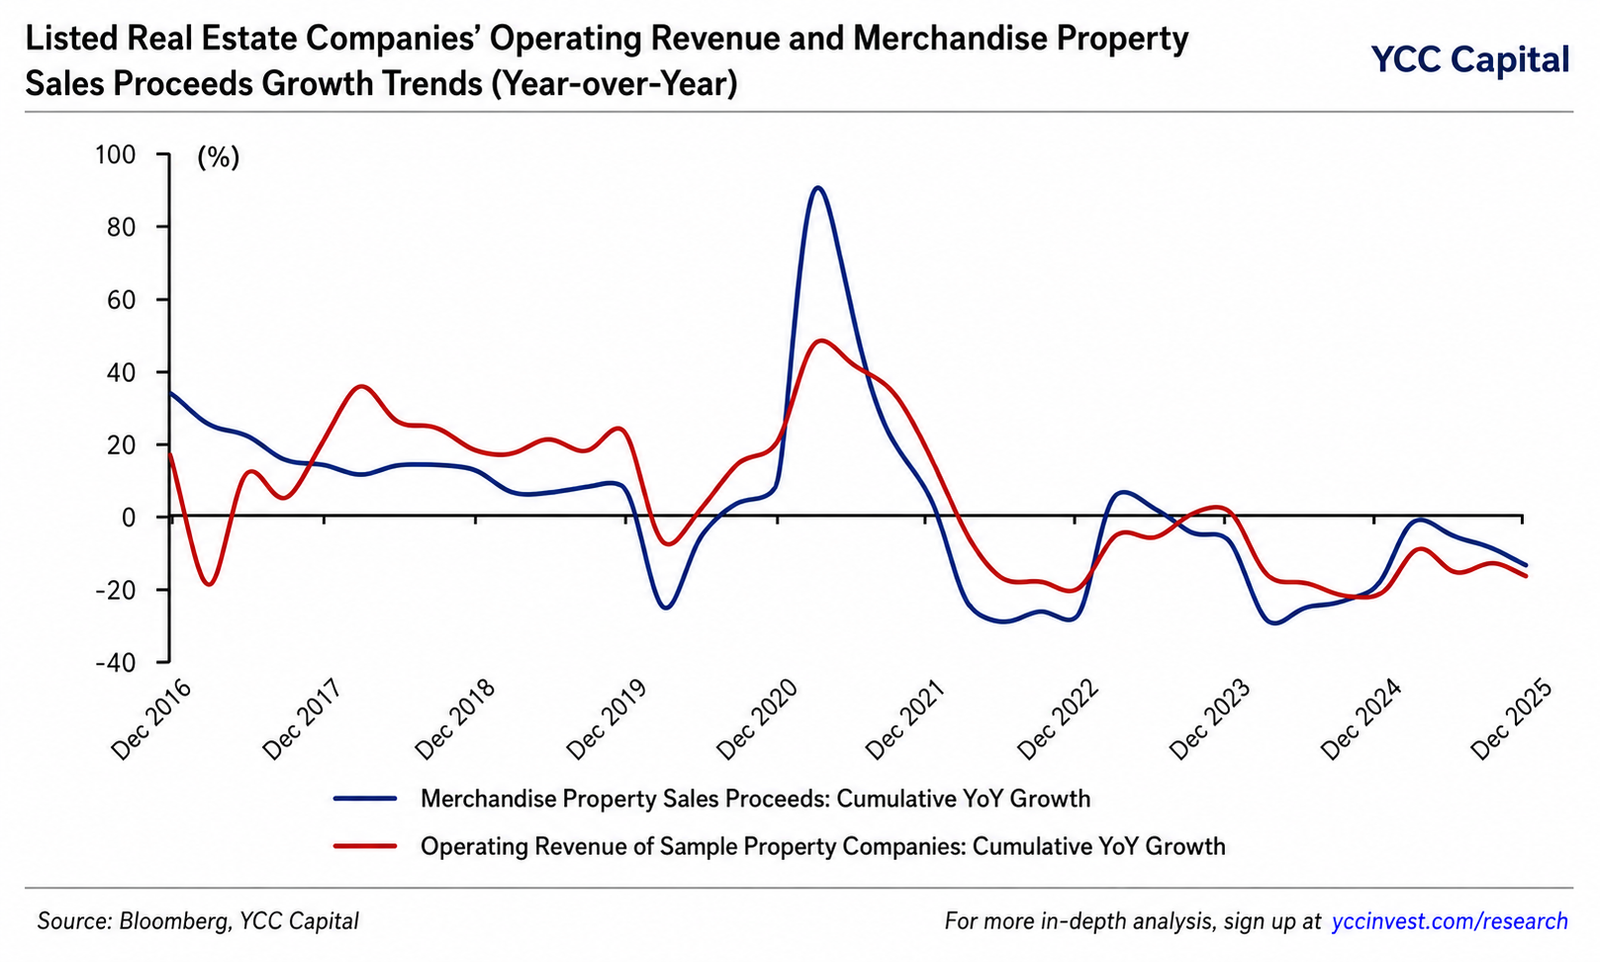
Sales Remain Weak Despite Signs of Stabilization
2025 marked another year of declining revenue for listed developers.
Total revenue among the sample group reached approximately RMB 3.55 trillion, down 17.6% year-over-year. While this represented an improvement from the 21% decline recorded in 2024, the industry remains firmly within a downcycle.
One of the most important indicators is contract liabilities—the pre-sold but not yet delivered housing inventory that represents future revenue.
At year-end 2025:
- Contract liabilities fell to RMB 2.04 trillion.
- This represented a 31% annual decline.
- Coverage of future revenue dropped to only 0.57x, far below the 1.01x peak reached in 2022.
This means developers are entering the next one to two years with a much thinner revenue pipeline.
A useful analogy is a factory running on a shrinking order book. Even if production becomes more efficient, future output becomes constrained when incoming orders continue to decline.
That is increasingly the challenge facing Chinese developers.
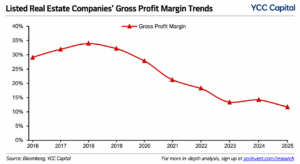
Profitability Remains Under Severe Pressure
Margins Continue to Deteriorate
The industry’s gross margin fell to 11.8% in 2025, the lowest level on record.
Two powerful forces continue to compress profitability:
1. Weak Pricing Power
Developers remain heavily reliant on discounts and promotional campaigns to generate cash flow.
2. Legacy High-Cost Land Banks
Projects acquired during the boom years continue to enter delivery phases.
These projects were purchased at much higher land costs than current market conditions justify.
As a result:
- Selling prices fall.
- Construction costs remain elevated.
- Margins get squeezed from both directions.
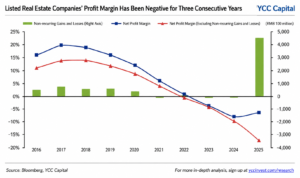
Losses Remain Widespread
More than 60% of listed developers reported net losses in 2025.
Asset impairments remain a major factor.
Developers continue to write down:
- Land reserves
- Unsold inventory
- Investment properties
- Commercial assets
The result is an industry still deeply challenged at the operational level.
Why Reported Losses Improved
At first glance, the numbers appear encouraging.
Industry net losses narrowed by approximately RMB 156 billion in 2025.
However, this improvement largely reflects debt restructuring gains rather than stronger business performance.
Developers undergoing restructuring recorded significant non-recurring gains.
Industry-wide non-recurring income reached roughly RMB 456 billion, the highest level on record.
Without these restructuring benefits:
- Net losses would actually have widened.
- Underlying profitability remains deeply negative.
The distinction matters.
A company can appear healthier because its debts were renegotiated, even while its core business continues to struggle.
Inventory: Falling, But For the Wrong Reasons
Inventory declined significantly during 2025.
Total inventory fell 15.7% year-over-year.
At first glance this sounds positive.
However, much of the reduction came from write-downs and impairments rather than successful sales.
Developers have increasingly chosen to recognize losses and reduce the book value of assets rather than wait indefinitely for market conditions to improve.
Inventory turnover remained largely unchanged:
- Inventory turnover period remained roughly 36 months.
This suggests the actual pace of inventory absorption remains slow.
The divide between cities is also becoming more pronounced:
Stronger Markets
- Beijing
- Shanghai
- Shenzhen
- Core Tier-2 cities
Weaker Markets
- Tier-3 cities
- Tier-4 cities
- Population outflow regions
Inventory pressure remains concentrated in weaker local markets.
Cash Flow: The Industry’s Core Challenge
If one metric captures the industry’s condition, it is cash flow.
The sector recorded negative aggregate cash flow for a fifth consecutive year.
Net cash flow reached approximately:
–RMB 177 billion
More than 70% of developers reported negative net cash flow.
Operating Cash Flow
Operating cash flow remained broadly stable because developers adopted what could be described as a “sell less, spend less” model.
As sales declined:
- Construction activity slowed.
- Procurement spending declined.
- New project commitments were reduced.
This kept operating cash flow from deteriorating further, but it also reinforced industry contraction.
Investment Activity
Investment cash outflows increased modestly.
Interestingly, stronger state-backed developers continued selectively purchasing land in prime cities.
This reflects a growing divergence:
- Strong firms are becoming stronger.
- Weak firms continue shrinking.
Financing Remains the Biggest Constraint
Financing cash flow remains deeply negative.
Despite government support programs and financing coordination mechanisms, developers continue to repay more debt than they can raise.
Financing cash outflows reached nearly RMB 476 billion in 2025.
This remains the single largest obstacle preventing a stronger recovery.
Growing Industry Polarization
One of the clearest themes emerging from 2025 data is increasing concentration.
State-owned and centrally controlled developers continue gaining market share.
Revenue Performance
2025 revenue:
- SOEs and state-backed developers: -2.8%
- Private developers: -31.8%
State-backed firms now account for more than half of industry revenue.
Profitability Gap
The profitability gap remains substantial.
Net margins:
- State-owned developers: -0.8%
- Private developers: -12.2%
Private developers continue facing:
- Higher financing costs
- Limited refinancing access
- Weaker buyer confidence
Market Concentration Rising
The ten largest developers accounted for 78.2% of total industry revenue in 2025.
This is nearly ten percentage points higher than 2021.
The industry’s future increasingly belongs to:
- Large-scale operators
- Strong balance sheets
- Stronger brands
- Access to funding
Debt Conditions: Improving but Not Fully Healed
Total Debt Is Falling
Aggregate liabilities declined 13.1% year-over-year to approximately RMB 15 trillion.
After excluding contract liabilities, adjusted leverage fell to:
65.1%
This represents continued progress toward deleveraging.
High-Leverage Risks Are Declining
The number of developers exceeding the 70% leverage threshold continued to decline.
The industry is gradually exiting the most dangerous phase of excessive leverage.
This is one of the most encouraging developments in the data.
Debt Structure Is Improving
Developers are not only reducing debt—they are changing its composition.
Positive Trends
- Short-term debt falling
- Long-term debt becoming more important
- Non-standard financing shrinking
- Greater reliance on conventional funding structures
Interest-bearing debt fell 9.5% in 2025, marking the third consecutive annual decline.
This represents a healthier liability profile than existed during the peak years of expansion.
The Remaining Vulnerability: Liquidity
Despite improving leverage, liquidity remains fragile.
Cash and cash equivalents declined to:
RMB 1.36 trillion
More importantly:
Cash-to-short-term debt ratio fell to only 0.56.
In practical terms, many developers lack sufficient cash to fully cover debt maturing within one year.
Private developers remain particularly vulnerable.
Bond Markets Remain Difficult
Developers continue experiencing negative net bond financing.
In 2025:
- Domestic credit bond issuance: RMB 342.9 billion
- Repayments: RMB 559.2 billion
- Net repayment: RMB 216.3 billion
Private developers face especially challenging conditions.
Average borrowing costs remain materially above those available to state-backed peers.
Capital markets have not yet fully reopened for the sector.
Strategic Conclusions
1. The Industry Is Still Bottoming
The foundations of recovery remain fragile.
Sales, prices, and inventory have not yet reached a self-sustaining positive cycle.
Recovery remains concentrated in major cities.
National stabilization remains incomplete.
2. Debt Repair Is Working
The most encouraging development is the progress in balance-sheet repair.
Debt restructuring, asset disposals, and deleveraging are producing measurable results.
Systemic financial risks are substantially lower than they were during the height of the crisis.
3. Financing Is the Key Missing Ingredient
The industry’s biggest challenge is no longer excessive leverage.
It is insufficient cash generation and limited financing access.
Until developers regain sustainable funding channels, investment activity is unlikely to recover meaningfully.
YCC Capital Strategic View
The Chinese property sector appears to be transitioning from a crisis of survival into a challenge of renewal.
That distinction is important.
The darkest phase of systemic risk appears increasingly behind us. However, stabilization should not be confused with recovery.
The next chapter will likely be characterized by:
- Industry consolidation
- Continued debt restructuring
- State-backed leadership
- Gradual inventory reduction
- Selective recovery in major urban centers
For investors, the key opportunity may not lie in a broad property rebound, but rather in identifying the companies and cities positioned to emerge stronger from a smaller, more disciplined, and more sustainable real estate market.
The era of rapid expansion is over. The era of balance-sheet repair and quality growth has begun.
Editorial Board
Ken Cao – Chief Strategist, Global Investment Strategy
Le Gao – Managing Analyst
Yui Nabeshima – Strategist
Mai Ikeda – Research Analyst
IMPORTANT DISCLAIMER
“This research report is provided for informational and educational purposes only and does not constitute an offer to sell or a solicitation of an offer to buy any securities, financial instruments, or investment products. It is not intended as investment, legal, accounting, or tax advice and should not be relied upon as such. The views, opinions, and projections expressed herein are those of YCC Capital Management and its research personnel as of the date of publication and are subject to change without notice. Past performance is not indicative of future results.
YCC Capital Management, its affiliates, principals, and employees may hold long or short positions in securities or instruments discussed in this report and may trade for their own accounts or for client accounts in a manner inconsistent with the recommendations herein. This report is based on publicly available information and data believed to be reliable, but YCC Capital makes no representation or warranty, express or implied, as to the accuracy, completeness, or timeliness of such information. Forward-looking statements involve risks and uncertainties that could cause actual results to differ materially from those projected.
Recipients of this report should conduct their own independent due diligence and consult with their own financial, legal, and tax advisors before making any investment decisions. YCC Capital accepts no liability for any loss or damage arising from the use of or reliance on this report or its contents.
This report is intended solely for the use of the intended recipient(s) and may not be reproduced or redistributed for commercial purposes without the prior written consent of YCC Capital. © 2026 YCC Capital. All rights reserved. YCC Capital’s flagship vehicle, the YCC International Value Fund, LP, maintains a concentrated global macro value strategy with a focus on capital-flow-driven mispricings and asymmetric hedging opportunities. The Fund is registered in the State of Delaware, U.S and structured as a 506(c) fund. Performance data, where referenced, has been verified by independent third parties including NAV Consulting; however, individual investor results may vary.”
Contact Us
YCC Capital Research
Email: ir@yccinvest.com
Sign up for free daily market insights and research updates at:
YCC Capital Research | Sign up for free daily market insight at www.yccinvest.com