YCC CAPITAL
Global Strategy
June 24, 2026
Executive Summary
Housing downturns often feel like watching a tide retreat. The first instinct is to stare at the shoreline and wait for the water to return. Yet history suggests that by the time the tide visibly comes back in, many of the most important signals have already appeared elsewhere.
Investors frequently focus on house prices themselves when attempting to identify a market bottom. Policymakers watch mortgage lending. Developers watch construction activity. Yet a review of 190 housing downturns across 57 economies over the past 55 years suggests that these indicators often arrive too late.
The global evidence points to a remarkably consistent sequence:
Consumption recovers first. House prices recover second. Credit growth and residential investment recover later.
This finding challenges several widely held assumptions about real estate cycles. More importantly, it provides a practical framework for evaluating where an economy sits within a housing correction.
The lessons extend beyond property markets. Housing is not merely an asset class. For many households, it represents the largest balance-sheet item, the largest source of leverage, and the single most important determinant of perceived wealth. Housing cycles therefore become macroeconomic cycles.
A family that bought a home near the peak often postpones furniture purchases, automobile upgrades, vacations, and discretionary spending. A developer delays projects. Banks tighten lending standards. Policymakers respond. Entire economic systems adjust around the housing market’s trajectory.
Yet history shows that recoveries rarely begin where investors expect them to.
The central conclusion from international experience is straightforward:
- The speed of leverage accumulation determines how deep prices fall.
- Residential investment dynamics determine how long prices fall.
- Consumption recovery helps determine when prices stop falling.
Together, these three variables form a practical roadmap for identifying housing-market turning points.
Sources: Bloomberg, YCC Capital.
YCC Perspective
One of the most persistent mistakes investors make is assuming that housing recoveries begin in housing.
In reality, housing is often one of the last major sectors to heal.
Consider a household after a property downturn. The family may remain reluctant to buy another home. They may still be worried about prices. Yet if employment stabilizes, wages improve, and confidence gradually returns, they may resume dining out, traveling, replacing appliances, or purchasing consumer electronics.
The recovery begins not with property transactions but with everyday life.
The global evidence repeatedly demonstrates that economic normalization usually starts before housing-market normalization becomes obvious.
For investors attempting to identify inflection points, this distinction matters enormously.
Three Common Misconceptions About Housing Recoveries
Across market cycles, three beliefs repeatedly emerge.
The first is that house prices must recover before consumption can recover.
The second is that households must resume borrowing before housing can stabilize.
The third is that residential construction must recover before house prices can bottom.
All three assumptions appear intuitive.
All three are largely contradicted by historical evidence.
Analysis of 190 housing downturns reveals a consistent sequencing pattern:
Consumption → House Prices → Credit ≈ Residential Investment
Consumption typically bottoms first.
House prices follow.
Credit expansion and residential investment generally recover afterward.
This pattern appears repeatedly across developed and emerging economies, across inflationary and deflationary environments, and across multiple institutional frameworks.
The implication is profound:
A housing market does not need to stop falling before consumption improves.
A household sector does not need to resume leveraging before housing stabilizes.
Residential investment does not need to recover before property prices reach a bottom.
Understanding these lead-lag relationships is essential for identifying turning points.
Part I: Consumption Is the Earliest Signal
The Global Evidence
The historical sample divides housing downturns into two categories:
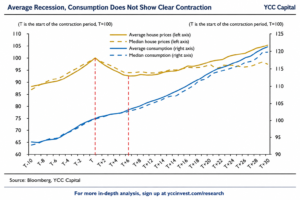
Ordinary Housing Recessions
These represent the majority of cases.
Average house-price declines are relatively modest.
Consumption generally continues growing, albeit at a slower pace.
In these episodes, consumption rarely experiences outright contraction.
Deep Housing Recessions
These represent the most severe quarter of observations.
House prices decline by more than 28.6%.
Consumption falls meaningfully.
These cases provide the clearest insights into turning-point behavior.
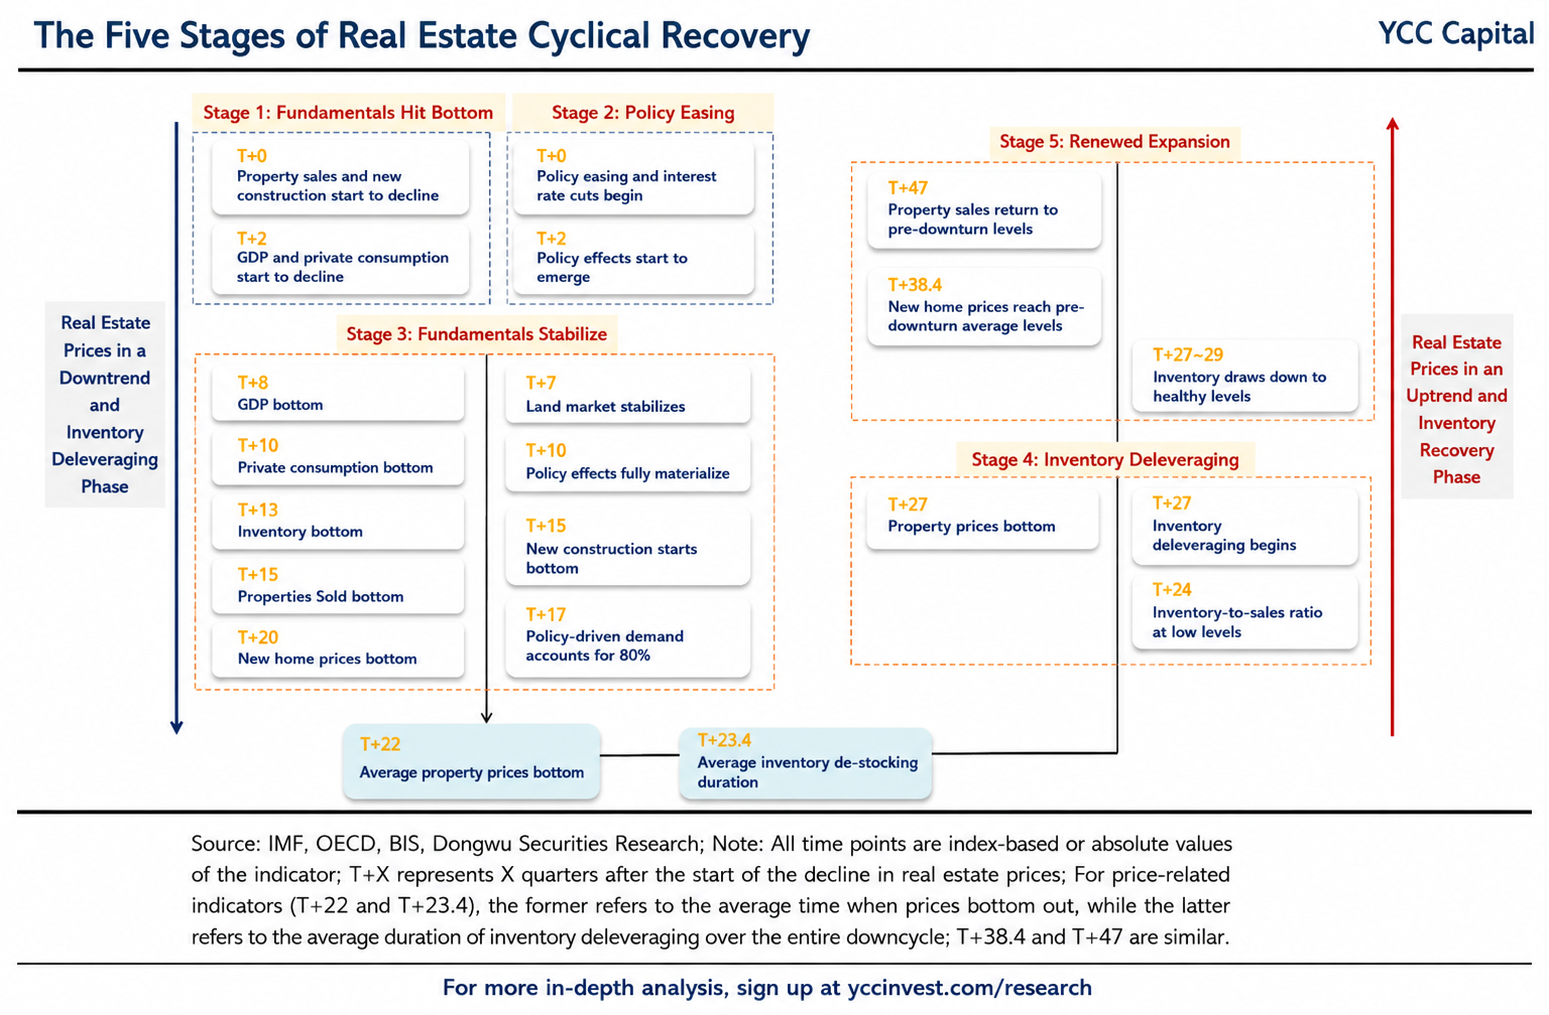
Among severe housing downturns:
- Consumption bottoms around T+10 quarters.
- House prices bottom around T+22 quarters.
Consumption therefore leads housing by approximately three years.
Even more striking:
Among cases where a consumption downturn can be clearly identified, consumption bottoms before house prices in nearly 87% of episodes.
This consistency makes consumption one of the most reliable leading indicators available.
Why Consumption Recovers First
Growth Becomes Less Dependent on Housing
During severe housing downturns, economies often enter a phase that can be described as de-real-estatized growth.
Economic activity gradually begins recovering outside the property sector.
Manufacturing stabilizes.
Employment improves.
Service-sector activity expands.
Income expectations recover.
GDP growth often turns before housing.
Across the international sample:
- GDP bottoms around T+8.
- Consumption bottoms around T+10.
- House prices bottom around T+22.
This creates a multi-year period during which economic growth resumes while housing remains weak.
The economy moves forward before property markets do.
Policy Support Reaches Consumers Faster
Fiscal and monetary easing also help explain consumption’s earlier recovery.
Governments frequently expand deficits during housing downturns.
Central banks cut rates aggressively.
Employment and corporate activity stabilize.
Income expectations improve.
Consumption responds relatively quickly because it is fundamentally an income-driven flow variable.
House prices, by contrast, remain constrained by:
- Excess inventory
- Weak credit creation
- Negative expectations
- Balance-sheet repair
- Supply overhangs
Housing therefore recovers much more slowly.
The Saturation and Replacement Cycle
A second explanation involves replacement cycles.
During housing booms, households rarely purchase only a home.
They often buy:
- Furniture
- Appliances
- Electronics
- Renovation services
- Home improvements
- Vehicles
Housing booms therefore pull future consumption forward.
Demand becomes front-loaded.
After the boom ends, both housing demand and related consumption experience a temporary vacuum.
The difference lies in replacement timing.
A refrigerator eventually needs replacement.
A washing machine eventually wears out.
A sofa becomes outdated.
These replacement cycles are relatively short.
Housing replacement cycles are far longer.
Homes depreciate slowly.
Transactions are expensive.
Financing matters.
Expectations matter.
Inventory matters.
As a result, consumption adjusts and recovers sooner.
Housing remains trapped in a longer cycle.
The Changing Structure of Consumption
Not all consumption categories behave similarly.
The international evidence reveals major differences.
Durable Goods
Durables experience the sharpest contractions.
Average declines reach approximately 14.6%.
Examples include:
- Automobiles
- Appliances
- Electronics
- Furniture
These purchases depend heavily on both purchasing power and perceived necessity.
During housing downturns, both weaken simultaneously.
However, durables also experience the strongest recoveries once conditions improve.
Semi-Durables
Semi-durable goods also decline meaningfully.
Examples include:
- Clothing
- Sporting equipment
- Household items
Demand remains cyclical but less volatile than durable goods.
Non-Durables
Non-durables display remarkable resilience.
Examples include:
- Food
- Beverages
- Household essentials
- Healthcare products
Average declines are minimal.
These expenditures cannot easily be postponed.
Services
Services emerge as the most stable component of consumption.
Examples include:
- Healthcare
- Education
- Transportation
- Entertainment
- Telecommunications
Average declines are approximately 1.4%.
Services function as a stabilizer throughout housing downturns.
The De-Real-Estatization of Consumption
One of the most important long-term findings is that housing-related consumption often fails to regain its previous prominence.
Durable goods spending associated with housing booms tends to lose share permanently.
The reason is intuitive.
A household that already owns major appliances, furniture, and household equipment does not need to repurchase them immediately after a downturn.
The higher the market’s initial penetration rate, the harder recovery becomes.
This pattern appears repeatedly across countries.
The result is a gradual shift toward service-oriented consumption structures.
Housing-led consumption becomes less dominant.
Part II: Credit Explains How Deep the Pain Becomes
What Determines Housing Crash Severity?
Most investors focus on debt levels.
History suggests this focus is misplaced.
The absolute level of household leverage has surprisingly little predictive power.
Across the international sample:
The correlation between household leverage ratios and subsequent house-price declines is almost zero.
High leverage alone does not guarantee a severe crash.
The Real Variable: Leverage Growth
What matters is not how much debt exists.
What matters is how quickly debt accumulated.
Rapid leverage expansion signals:
- Aggressive lending
- Looser underwriting
- Increased speculative activity
- Faster separation between prices and fundamentals
When debt expands faster than incomes, vulnerabilities accumulate.
Eventually, the market becomes dependent on continuous credit expansion.
When credit conditions tighten, these vulnerabilities emerge rapidly.
House prices then experience deeper corrections.
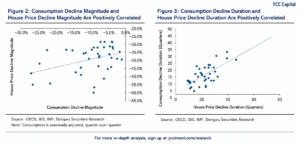
Historical data show a statistically significant relationship between pre-boom leverage acceleration and subsequent price declines.
The lesson is simple:
Fast leverage growth is more dangerous than high leverage itself.
Why Rising Markets Create Future Crashes
Housing cycles frequently display a cruel symmetry.
The stronger the boom, the deeper the bust.
Across severe housing downturns:
Average pre-crisis price appreciation approached 90%.
By contrast, ordinary downturns were preceded by gains closer to 31%.
This reinforces an important principle:
Excessive upside often plants the seeds of future downside.
Part III: Credit Recovery Arrives Late
Another common misconception is that housing cannot recover until borrowing recovers.
The evidence suggests otherwise.
House prices generally stabilize before household credit growth resumes.
Across the sample:
- House prices bottom around T+22.
- Credit growth bottoms closer to T+30 or later.
Why?
Because balance-sheet repair takes time.
Existing mortgages continue being repaid.
Banks remain cautious.
Borrowers remain cautious.
Credit demand improves gradually.
Housing prices can stabilize well before aggregate borrowing expands again.
The Banking Constraint
Another reason for delayed credit recovery is banking behavior.
During housing downturns:
Central banks often ease aggressively.
Yet commercial banks frequently tighten lending standards.
This creates a paradox:
Monetary policy becomes easier.
Credit availability becomes tighter.
Historical evidence suggests loan demand often improves well before net credit creation turns positive.
Housing stabilization therefore occurs before broad-based releveraging.
Part IV: Residential Investment Determines Duration
If leverage determines depth, residential investment determines duration.
Housing downturns are fundamentally supply-adjustment processes.
The key question becomes:
How much supply was created during the boom?
And how quickly does that supply disappear?
Residential Investment as a Supply Signal
Residential investment tracks future inventory.
When investment expands rapidly during a boom:
- More projects begin.
- More units are completed.
- More supply enters the market.
When investment remains elevated after prices begin falling:
Supply pressure continues.
Prices remain under pressure.
The adjustment process lengthens.
Measuring Duration
Two variables explain much of the variation in housing downturn length:
- The speed of residential investment growth before the peak.
- The time required for investment to decline substantially after the peak.
Together these variables explain nearly 60% of the variation in housing-downturn duration.
That is an unusually powerful relationship for cross-country macroeconomic research.
Japan: The Classic Example
Japan’s post-1991 experience illustrates the mechanism.
Investment had expanded rapidly during the boom.
After the peak, supply adjustment occurred only gradually.
New inventory continued entering the market.
Expectations remained weak.
Housing prices continued falling for years.
The downturn persisted for nearly two decades.
The lesson is clear:
Housing recoveries depend not merely on demand stabilization but on supply normalization.
Implications for China
China’s property downturn remains one of the most important macroeconomic developments in the global economy.
From a historical perspective, several characteristics resemble prolonged housing corrections rather than short cyclical slowdowns.
These include:
- Excess residential supply
- Demographic headwinds
- Elevated inventory levels
- Weak household confidence
- Structural overinvestment during the boom period
International experience suggests that supply adjustment will likely remain a critical determinant of duration.
At the same time, history indicates that consumption stabilization may emerge before housing-market stabilization becomes visible.
Investors should therefore monitor consumption trends closely rather than relying exclusively on property data.
The broader lesson from international experience is that property markets can remain weak even while large parts of the economy gradually normalize.
Investment Implications
Housing downturns are often interpreted through a single lens.
History suggests a more nuanced framework.
To estimate how deep prices may fall:
Monitor leverage acceleration during the boom.
To estimate how long prices may fall:
Monitor residential-investment adjustment.
To identify when prices may bottom:
Monitor consumption recovery.
No single indicator is sufficient.
Together, however, they provide a remarkably effective roadmap.
Conclusion
The history of 190 housing downturns across 57 economies delivers a surprisingly consistent message.
Consumption leads.
House prices follow.
Credit and residential investment lag.
The speed of leverage accumulation determines the severity of housing corrections.
The pace of supply adjustment determines their duration.
Consumption recovery provides the clearest advance warning of eventual stabilization.
For investors, policymakers, and business leaders, the lesson is straightforward.
When searching for a housing-market bottom, do not focus exclusively on housing.
Watch consumers.
The family replacing a refrigerator, taking a vacation, or feeling confident enough to spend again may reveal more about tomorrow’s housing market than today’s property transaction data.
History suggests that by the time housing recovery becomes obvious, the foundations of that recovery were laid years earlier.
Sources
Bloomberg, YCC Capital. Analysis based on international housing-cycle data covering 57 economies and 190 housing downturns over the past 55 years.
Editorial Board
Ken Cao
Chief Strategist, Global Investment Strategy
Le Gao
Managing Analyst
Yui Nabeshima
Strategist
Mai Ikeda
Research Analyst
IMPORTANT DISCLAIMER
“This research report is provided for informational and educational purposes only and does not constitute an offer to sell or a solicitation of an offer to buy any securities, financial instruments, or investment products. It is not intended as investment, legal, accounting, or tax advice and should not be relied upon as such. The views, opinions, and projections expressed herein are those of YCC Capital Management and its research personnel as of the date of publication and are subject to change without notice. Past performance is not indicative of future results.
YCC Capital Management, its affiliates, principals, and employees may hold long or short positions in securities or instruments discussed in this report and may trade for their own accounts or for client accounts in a manner inconsistent with the recommendations herein. This report is based on publicly available information and data believed to be reliable, but YCC Capital makes no representation or warranty, express or implied, as to the accuracy, completeness, or timeliness of such information. Forward-looking statements involve risks and uncertainties that could cause actual results to differ materially from those projected.
Recipients of this report should conduct their own independent due diligence and consult with their own financial, legal, and tax advisors before making any investment decisions. YCC Capital accepts no liability for any loss or damage arising from the use of or reliance on this report or its contents.
This report is intended solely for the use of the intended recipient(s) and may not be reproduced or redistributed for commercial purposes without the prior written consent of YCC Capital. © 2026 YCC Capital. All rights reserved. YCC Capital’s flagship vehicle, the YCC International Value Fund, LP, maintains a concentrated global macro value strategy with a focus on capital-flow-driven mispricings and asymmetric hedging opportunities. The Fund is registered in the State of Delaware, U.S and structured as a 506(c) fund. Performance data, where referenced, has been verified by independent third parties including NAV Consulting; however, individual investor results may vary.”
Contact Us
YCC Capital Research
Email: ir@yccinvest.com
For free daily macro and market insights, subscribe at:
Footer (for every page):
YCC Capital Research | Sign up for free daily market insight at www.yccinvest.com