YCC Perspective
Every major bull market eventually faces a moment that tests conviction.
For gold investors, June 2026 has been exactly that moment.
After climbing relentlessly for more than a year and reaching an unprecedented peak above $5,500 per ounce, gold suddenly suffered one of its sharpest declines in recent history. For many investors, the move felt less like a correction and more like an air pocket.
The experience resembles a crowded theater when someone unexpectedly opens a side exit. For a few moments, nobody knows whether to stay seated or rush toward the door. Markets often behave the same way. When positioning becomes crowded, even a modest shift in expectations can trigger a cascade of selling.
The critical question now is straightforward:
Has the gold bull market ended, or is this simply a violent reset within a larger structural uptrend?
Our assessment is that while the near-term technical damage is significant, the long-term macro foundations supporting gold remain largely intact.
Executive Summary
Key Conclusions
- Gold experienced a sharp correction in June 2026 after reaching an all-time high of $5,598.75 per ounce earlier in the year.
- Three simultaneous bearish catalysts drove the decline:
- Reacceleration of U.S. inflation.
- Stronger-than-expected labor market data.
- Capital rotation from defensive assets toward AI-linked growth opportunities.
- Crowded long positioning amplified the selloff through systematic deleveraging and stop-loss activity.
- Gold ETFs have experienced continued outflows while speculative net-long futures positioning has declined materially.
- Technical support has emerged in the $4,100–$4,200 range.
- Significant overhead resistance remains around $4,450–$4,500.
- The structural bull-market drivers—including global debt accumulation, reserve diversification, central-bank purchases, and persistent geopolitical fragmentation—remain in place.
Weekly Observation
Is the Gold Bull Market Over?
The international gold market experienced a dramatic reversal during June 2026.
Following the extraordinary momentum generated by the 2025 super-cycle rally, spot gold continued climbing into early 2026 and ultimately reached a historic peak of $5,598.75 per ounce in February.
However, over the following four months, prices steadily retraced.
The most severe phase occurred between June 5 and June 10, when gold declined for four consecutive trading sessions. By mid-June, all gains achieved during 2026 had effectively been erased, returning prices close to levels seen at the end of 2025.
For investors who entered near the highs, the decline has been painful. Yet market history suggests that major secular trends rarely move in straight lines. The strongest bull markets often contain the sharpest corrections.
Why Did Gold Fall So Quickly?
1. Inflation and Employment Repriced Interest-Rate Expectations
The first shock came from the U.S. macroeconomic data.
May CPI accelerated to 4.2% year-over-year, the highest reading in three years.
At the same time, U.S. nonfarm payrolls increased by 172,000, nearly double market expectations of approximately 88,000.
The combination of stronger inflation and stronger employment fundamentally altered market expectations regarding Federal Reserve policy.
Interest-rate markets rapidly shifted toward:
- Higher-for-longer rates.
- Reduced probability of future easing.
- Increased probability of renewed tightening.
According to market pricing, the likelihood of the Federal Reserve maintaining current rates at the June meeting rose to nearly 99%, while expectations for potential rate hikes later in the year increased substantially.
As a result:
- U.S. Treasury yields moved higher.
- The U.S. dollar strengthened.
- The opportunity cost of holding non-yielding assets such as gold increased significantly.
Historically, this environment has rarely been favorable for precious metals.
2. AI Became the Market’s Dominant Narrative
The second catalyst was investor psychology.
Throughout 2024 and 2025, gold benefited from:
- Recession fears.
- Geopolitical uncertainty.
- Fiscal concerns.
- Reserve diversification.
By mid-2026, however, the dominant market narrative shifted toward artificial intelligence.
As earnings visibility improved across the semiconductor and AI ecosystem, institutional capital increasingly rotated toward growth-oriented opportunities.
Recent global fund-manager surveys showed that long positions in semiconductors ranked among the most crowded trades worldwide, while long-gold positioning declined substantially.
Capital that had previously sought safety began pursuing growth.
In markets, narratives matter because narratives direct flows.
And flows often matter more than valuation in the short run.
3. Crowded Positioning Triggered a Liquidation Spiral
The third factor was market structure.
The rapid rally earlier in the year created an extremely crowded long position.
Initially, gold bulls defended the psychologically important $5,000 level.
However, once prices broke below successive support zones around:
- $4,500
- $4,300
- $4,200
systematic selling accelerated.
The process became self-reinforcing:
Price decline → forced liquidation → additional selling → further price decline
This dynamic was visible through:
- Gold ETF outflows.
- Falling CFTC net-long positioning.
- Reduced trend-following exposure.
- Systematic risk reduction across macro portfolios.
The result was less a change in gold’s long-term story and more a violent unwinding of excessive optimism.
The Road Ahead
Near-Term Outlook
Gold has begun finding support between $4,100 and $4,200 per ounce.
A modest technical rebound emerged following easing tensions surrounding U.S.-Iran developments and a softer U.S. dollar.
Nevertheless, the durability of this recovery remains uncertain.
A significant volume of trapped positioning now exists between $4,450 and $4,500.
Many investors who purchased near these levels may seek to exit on future rallies, creating persistent overhead resistance.
Consequently, a rapid return to previous highs appears unlikely in the immediate future.
Our base case remains:
- Stabilization rather than immediate recovery.
- Range-bound trading rather than a straight-line rally.
- Continued sensitivity to interest-rate expectations.
Why the Structural Bull Case Still Matters
Despite recent turbulence, the fundamental pillars supporting gold have not disappeared.
Global Debt Expansion
Public-sector debt continues to rise across major economies.
The long-term sustainability of sovereign balance sheets remains a central macro concern.
Historically, gold has performed well during periods when confidence in fiscal discipline deteriorates.
De-Dollarization Trends
Central banks continue to diversify reserve holdings.
While the U.S. dollar remains dominant, reserve managers increasingly seek diversification through:
- Gold.
- Regional currencies.
- Bilateral settlement mechanisms.
Gold remains one of the few reserve assets without sovereign credit risk.
Central-Bank Purchases
Official-sector demand remains a powerful structural support.
Central banks have become one of the most consistent sources of gold demand globally.
These purchases are strategic rather than speculative, making them less sensitive to short-term market fluctuations.
Persistent Geopolitical Risk
The world continues to experience:
- Great-power competition.
- Supply-chain fragmentation.
- Regional military conflicts.
- Energy-security concerns.
These conditions create an environment in which demand for strategic safe-haven assets remains elevated.
Multi-Asset Dashboard
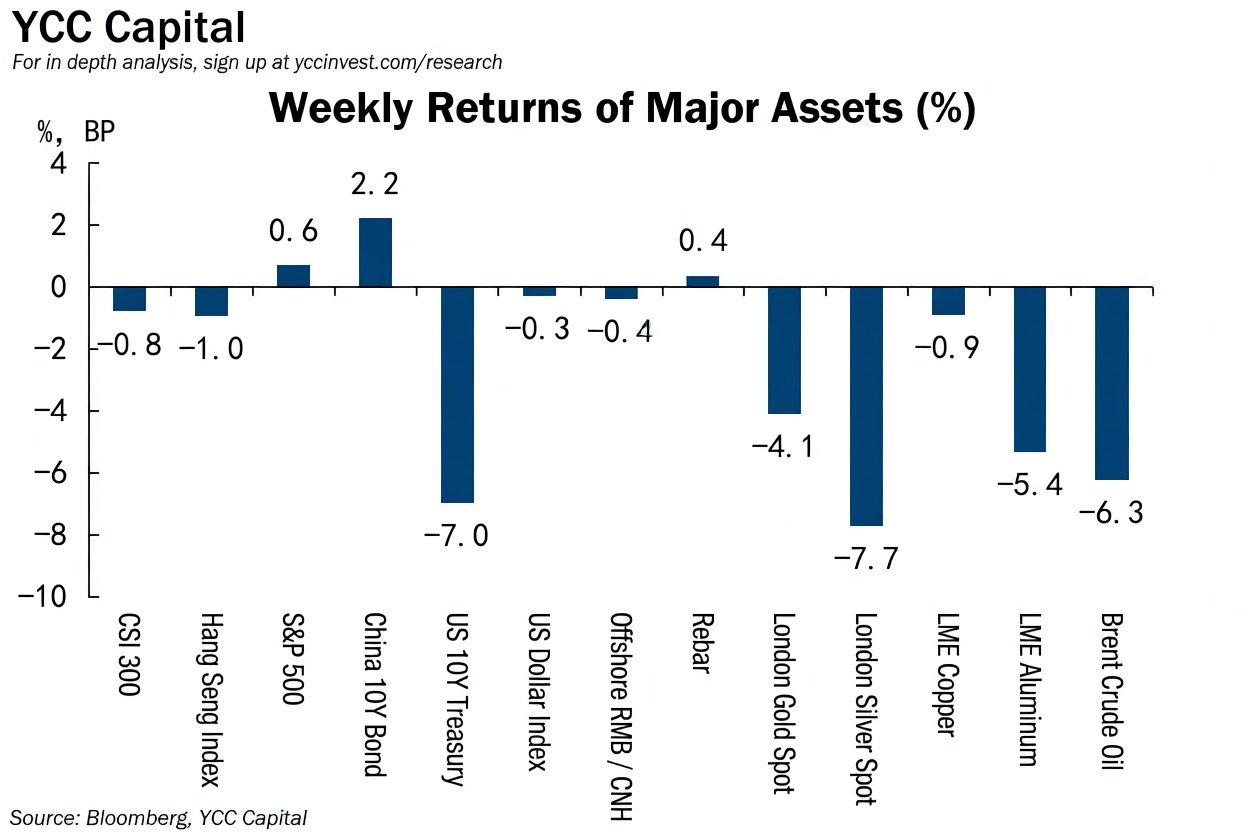
Weekly Performance
(June 6–June 13, 2026)
Equities
| Asset | Weekly Return |
|---|---|
| CSI 300 | -0.83% |
| Hang Seng Index | -0.98% |
| S&P 500 | +0.65% |
Fixed Income
| Asset | Weekly Change |
|---|---|
| China 10Y Government Bond | +2.2 bp |
| U.S. 10Y Treasury | -7 bp |
Foreign Exchange
| Asset | Weekly Change |
|---|---|
| U.S. Dollar Index | -0.28% |
| Offshore RMB | +0.41% |
Commodities
| Asset | Weekly Return |
|---|---|
| SHFE Rebar | +0.37% |
| Spot Gold | -4.11% |
| Spot Silver | -7.75% |
| LME Copper | -0.94% |
| LME Aluminum | -5.36% |
| WTI Crude Oil | -6.26% |
Relative Asset Valuation Indicators
| Indicator | Latest |
|---|---|
| Gold/Silver Ratio | 62.45 |
| Copper/Oil Ratio | 160.27 |
| Copper/Rebar Ratio | 32.92 |
| Gold/Copper Ratio | 0.31 |
| Equity-Bond Relative Value | 4.09 |
| A-H Share Premium | 120.65 |
Inventory Trends
Latest weekly inventory readings show:
| Commodity | Latest Level | Weekly Change |
|---|---|---|
| U.S. Crude Oil | 450.8 million tonnes | -9.11 million tonnes |
| Rebar | 4.79 million tonnes | Unchanged |
| Cathode Copper | 188,247 tonnes | -18,735 tonnes |
| Aluminum | 1.27 million tonnes | -60,000 tonnes |
The decline in copper and aluminum inventories continues to suggest relatively resilient industrial demand despite broader macro uncertainty.
Capital Flows and Positioning
U.S. Dollar Futures
- Long positions: 27,908 contracts
- Weekly increase: 3,324 contracts
U.S. Dollar Short Positions
- 26,524 contracts
- Weekly increase: 5,698 contracts
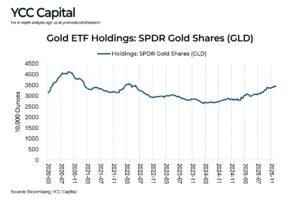
Gold ETF Holdings
- 32.58 million ounces
- Weekly decline: 210,000 ounces
The decline in ETF holdings confirms that institutional investors have reduced exposure during the recent correction.
Strategic Conclusion
Gold has suffered a significant setback, but setbacks are not always endings.
The current correction reflects a combination of macro repricing, capital rotation, and crowded-position liquidation rather than a complete collapse of the structural investment thesis.
Near-term volatility is likely to remain elevated. Interest-rate expectations, AI-driven equity enthusiasm, and investor positioning will continue to influence price action.
However, the broader forces that fueled the secular gold bull market—fiscal expansion, reserve diversification, central-bank demand, and geopolitical uncertainty—remain firmly in place.
For long-term investors, the key question may not be whether gold experienced a correction.
The more important question is whether the world has become materially less indebted, less fragmented, and less geopolitically uncertain.
At present, the answer appears to be no.
YCC View: The secular bull narrative is weakened but not broken. Gold is transitioning from euphoria to consolidation rather than from bull market to bear market.
Editorial Board
Ken Cao
Chief Strategist, Global Investment Strategy
Akiko Ikezawa
Managing Analyst
Yui Nabeshima
Strategist
Mai Ikeda
Research Analyst
IMPORTANT DISCLAIMER
“This research report is provided for informational and educational purposes only and does not constitute an offer to sell or a solicitation of an offer to buy any securities, financial instruments, or investment products. It is not intended as investment, legal, accounting, or tax advice and should not be relied upon as such. The views, opinions, and projections expressed herein are those of YCC Capital Management and its research personnel as of the date of publication and are subject to change without notice. Past performance is not indicative of future results.
YCC Capital Management, its affiliates, principals, and employees may hold long or short positions in securities or instruments discussed in this report and may trade for their own accounts or for client accounts in a manner inconsistent with the recommendations herein. This report is based on publicly available information and data believed to be reliable, but YCC Capital makes no representation or warranty, express or implied, as to the accuracy, completeness, or timeliness of such information. Forward-looking statements involve risks and uncertainties that could cause actual results to differ materially from those projected.
Recipients of this report should conduct their own independent due diligence and consult with their own financial, legal, and tax advisors before making any investment decisions. YCC Capital accepts no liability for any loss or damage arising from the use of or reliance on this report or its contents.
This report is intended solely for the use of the intended recipient(s) and may not be reproduced or redistributed for commercial purposes without the prior written consent of YCC Capital. © 2026 YCC Capital. All rights reserved. YCC Capital’s flagship vehicle, the YCC International Value Fund, LP, maintains a concentrated global macro value strategy with a focus on capital-flow-driven mispricings and asymmetric hedging opportunities. The Fund is registered in the State of Delaware, U.S and structured as a 506(c) fund. Performance data, where referenced, has been verified by independent third parties including NAV Consulting; however, individual investor results may vary.”
Contact Us
YCC Capital Research
Sign up for our free daily market insights, macro strategy updates, and investment research publications.
Sources: Bloomberg, YCC Capital. Based on analysis of the original research report.
Footer on every page:
YCC Capital Research | Sign up for free daily market insight at www.yccinvest.com