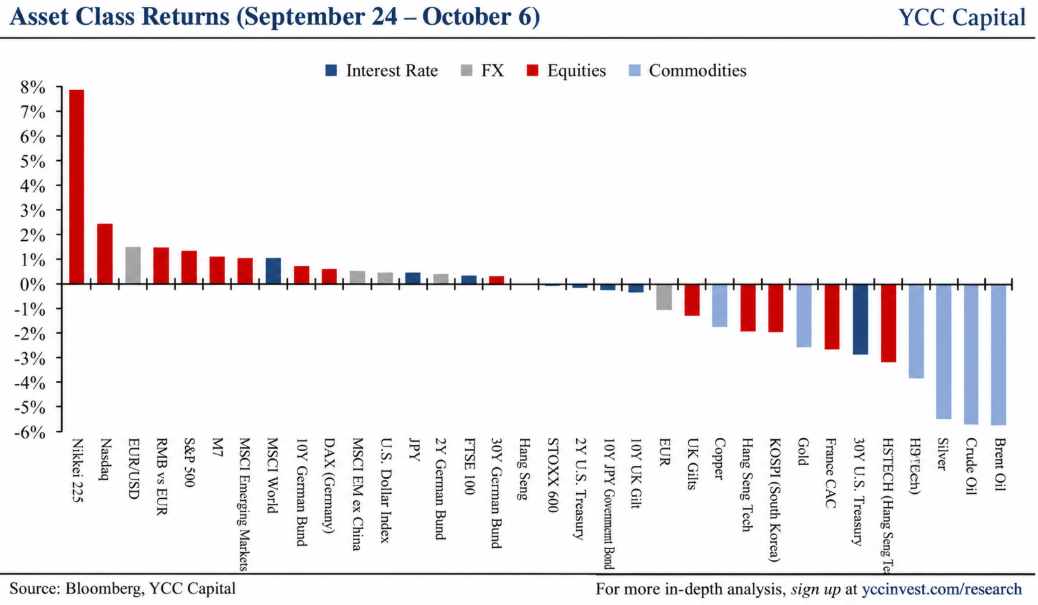
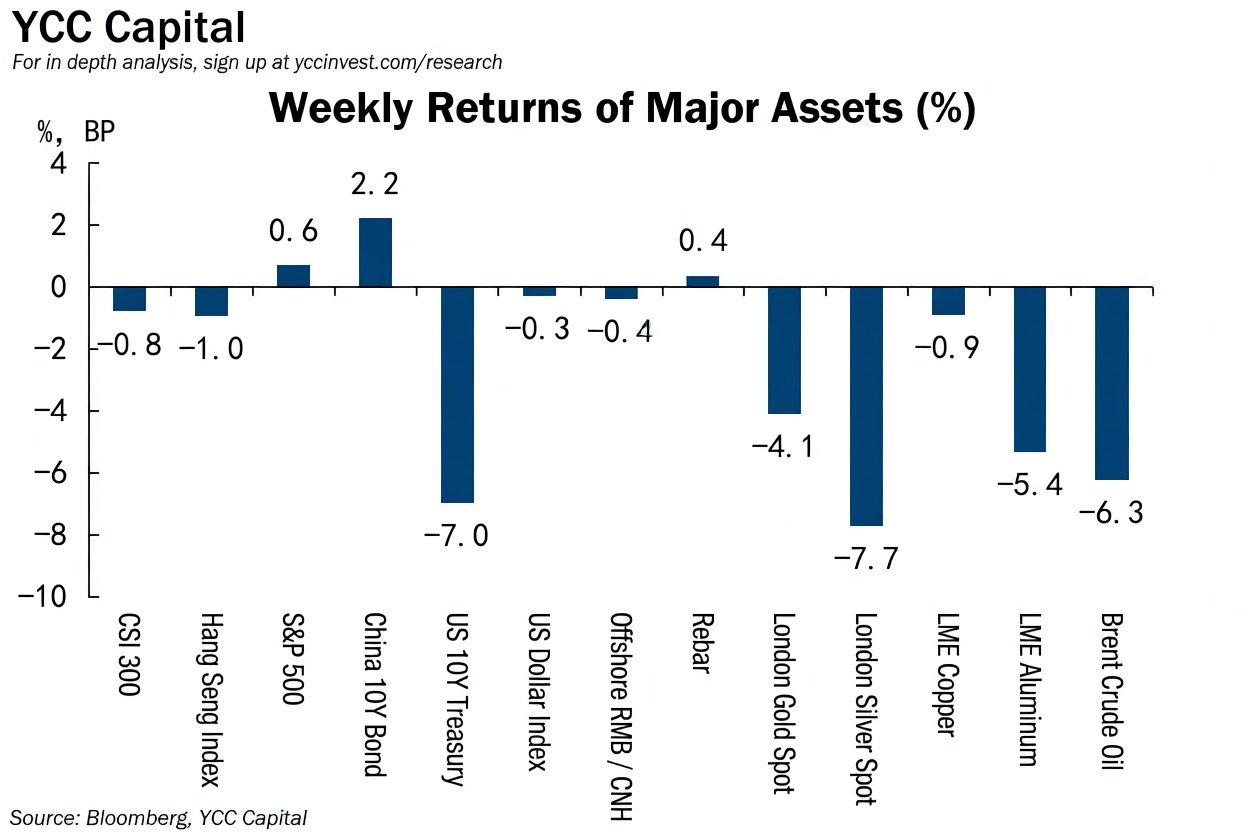
YCC CAPITAL Global Asset Allocation October 8, 2026 Global markets have just delivered an unusually revealing combination: long-term interest rates rose sharply, yet U.S. equities recovered strongly. Oil and precious metals fell, the dollar strengthened, European equities weakened, and Japanese and Korean stocks rallied alongside U.S. technology. Rather than treating these moves as contradictions, YCC Capital sees them as different expressions of the same macro transition. Markets are becoming less worried about an imminent Federal Reserve hike while simultaneously assigning greater value—and a higher term premium—to durable U.S. growth. That distinction matters. A rising 10-year Treasury yield caused by stronger growth expectations is very different from one driven purely by tighter monetary policy. For investors, it is the difference between a higher mortgage payment because the economy is overheating and a higher mortgage payment because household income prospects have improved. The cost of capital rises in both cases, but the implications for earnings and risk assets are not remotely identical. Cross-Asset Markets: Four Forces Behind the Divergence Between September 25 and October 6, global asset performance diverged sharply. Japan’s Nikkei 225 surged 7.89%, leading major equity indices, while U.S. and Korean technology shares also strengthened. European equities moved in the opposite direction. In fixed income, the U.S. 10-year Treasury yield briefly exceeded 5.3%, with the curve steepening materially. The dollar strengthened to its highest level since May 2025, while the euro weakened. Brent crude fell 5.65%, and gold and silver came under significant pressure as global long-duration yields climbed. Source: Bloomberg, YCC Capital. We see four forces driving this landscape. First, oil’s geopolitical premium eased as expectations improved around Middle Eastern supply. Progress remained uneven in U.S.-Iran diplomacy and arrangements surrounding shipping routes, but reports of increased Saudi Red Sea loadings, partial Strait of Hormuz transportation and greater Oman Gulf transshipment reduced fears of severe export disruption. In early October, G7 measures involving strategic oil reserves and OPEC+’s decision to maintain production further moderated supply anxiety. Brent consequently moved back below $100 per barrel at one stage. Second, expectations for another near-term Federal Reserve hike declined. Revised PCE inflation was softer, September payroll growth disappointed, and senior Fed officials adopted a less aggressive tone. August headline PCE inflation was reported at 3.4% year over year, below the 3.7% consensus expectation, while September nonfarm payrolls increased by only 29,000, versus 90,000 expected. Unemployment unexpectedly rose to 4.2%, and wage growth softened. At one point, market-implied odds of an October hike dropped below 20%. Source: Bloomberg, YCC Capital. Third, falling expectations for the next Fed hike did not translate into falling long-term yields. Stronger U.S. growth expectations, persistent inflation uncertainty and spillovers from rising overseas yields pushed term premiums higher. Europe faced a less constructive version of the same rate shock: French fiscal concerns intensified following the October 1 presentation of the 2027 budget, raising doubts about the political feasibility of deficit reduction. Fourth, AI fundamentals remained powerful enough to offset part of the valuation pressure from higher rates. Microsoft’s Copilot upgrade reinforced expectations for AI commercialization, Micron’s stronger-than-expected guidance supported the memory-demand story, and Nvidia announced an additional $150 billion share-repurchase authorization. Technology therefore remained the engine of U.S., Japanese and Korean equity performance. The U.S. Economy Looks Stronger Than the Old Data Suggested The most consequential development may be the revision of the U.S. national accounts. The updated figures simultaneously strengthened the recent growth picture and softened measured inflation—an unusually favorable combination. Annualized real GDP growth for 2026 Q1 and Q2 was revised upward by 0.4 and 0.7 percentage points, respectively. More importantly, private domestic final purchases—the component we regard as a cleaner measure of underlying private-sector demand—were revised upward by 0.1 and 0.4 percentage points to 3.3% and 4.2%. Source: Bloomberg, YCC Capital. Inflation revisions moved in the opposite direction. Changes to PCE measurement, including portfolio-management services, legal services and computer software, materially lowered the 2026 inflation trajectory. July headline PCE was revised from 3.7% to 3.34%, while core PCE was revised from 3.36% to 2.98%. August readings stood at approximately 3.42% headline and 3.01% core. Household fundamentals also look healthier. Real disposable personal income was revised higher across the past five years, while the household saving rate was increased materially. Since April, the estimated saving rate was lifted from below 3% to above 4%, reaching 4.09% in August. Source: Bloomberg, YCC Capital. This helps explain a puzzle that has frustrated bearish U.S. forecasts: consumers have continued spending despite restrictive interest rates. The household balance sheet had more breathing room than previously measured. Anyone who has managed a family budget understands the difference between spending from a nearly empty checking account and spending while quietly rebuilding savings. The headline purchase looks identical; the resilience behind it does not. We therefore remain cautiously optimistic on the United States. September’s weak payroll number deserves attention, but a single volatile employment print is insufficient to overturn broader evidence of resilient domestic demand. The Yield Curve Is Sending a Different Message After the stronger-than-expected September 23 U.S. PMI release, the Treasury term spread bottomed and subsequently widened. Earlier, hawkish guidance from Jackson Hole and the September FOMC had pushed two-year yields higher as investors priced tighter policy. Since September 24, however, softer payrolls, consumer confidence and ISM readings—combined with dovish Fed communication—have driven October hike expectations from roughly 70% to about 19%. Yet long yields continued rising. That is the critical signal. The market increasingly appears to be pricing a lower probability of immediate Fed tightening but a higher equilibrium for nominal growth and term premium. We expect the Fed may skip an October hike, while retaining flexibility thereafter. This is not the same thing as declaring victory over inflation. Europe faces a more difficult configuration. French fiscal risk and sticky inflation have increased long-duration risk premiums without a comparable improvement in growth expectations. The euro consequently weakened, the dollar index moved above 102, and European equities lagged U.S. markets. Source: Bloomberg, YCC Capital. Equities: Technology Wins, but Concentration Is the Price
AI’s Reality Check: From Capacity to Cash Flow
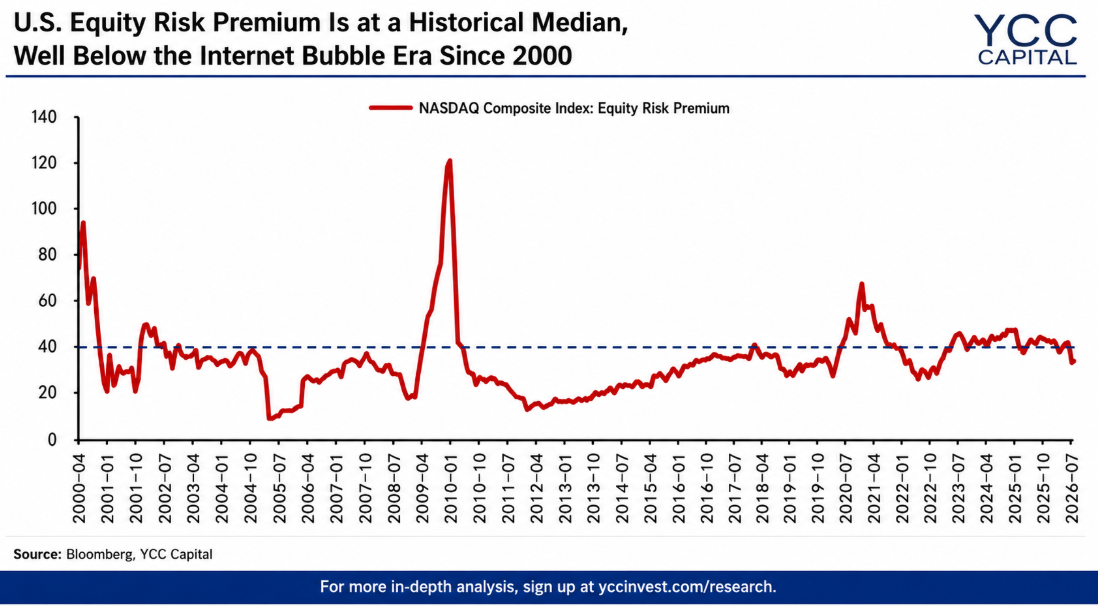
YCC CAPITAL Global Asset Allocation August Global Asset Allocation Outlook August 13, 2026 YCC Capital Perspective July reminded investors of an old market truth: when everyone is standing on the same side of the boat, it does not take a storm to make the deck tilt. The month combined renewed Middle East geopolitical stress with a sharp reassessment of crowded AI trades. Former leadership areas corrected violently, deeply oversold assets rebounded, and global markets moved through a broad mean-reversion phase. The more important change, however, was not simply price action. The AI investment narrative itself is maturing. Investors are shifting from asking how much capital companies can spend to asking what that spending actually earns. The market is moving from a capacity story to an efficiency story—from racks, chips and data centers to revenue conversion, margins, cash flow and return on invested capital. That distinction will matter across equities, bonds and commodities through the remainder of 2026. Global Assets: Mean Reversion Takes Control July produced one of the clearest rotations of the year. Brent crude gained 23.6% during the month as renewed U.S.-Iran tensions and restrictions around strategically important shipping routes revived supply concerns. Gold rose 0.8%, ending four consecutive months of declines, while silver stabilized more cautiously. Copper and aluminum remained relatively resilient as AI infrastructure and power-grid investment continued to support demand. Equity performance was more uneven. The Philadelphia Semiconductor Index fell by more than 20% as investors reduced exposure to crowded AI hardware positions. Korea was hit by simultaneous deleveraging in chip shares and regulatory uncertainty. In China, the ChiNext Index fell 23.0% in July, while the Shanghai Composite declined 6.4%. The damage was amplified by leveraged positioning rather than by a comparable deterioration in underlying earnings expectations. Hong Kong moved in the opposite direction, gaining 13.1%, supported by low valuations, dividend exposure and renewed foreign inflows. We would resist extrapolating that relative strength into a broader bullish China thesis. China’s underlying macro picture remains weak: property is still contracting, private-sector confidence is fragile, investment appetite is poor, and policy remains focused on preventing disorder rather than engineering a durable reacceleration. In the United States, the S&P 500 was broadly flat in July while the Nasdaq declined 3.2%. We view the U.S. correction as healthier than alarming. Valuations remain elevated in selective growth segments, but they are nowhere close to the extremes seen during the 2000 technology bubble. The U.S. also retains a stronger combination of household demand, innovation, fiscal support and corporate profitability than most major economies. AI: The Market Now Wants Receipts The first stage of the AI trade rewarded spending. When computing supply was scarce, capital expenditure itself became evidence of future growth. That phase is ending. Cloud companies are now spending at extraordinary levels, and free cash flow is becoming tighter. Investors are therefore demanding proof that each dollar of capital expenditure can be transformed into revenue, earnings and durable cash generation. Companies with strong ROIC are increasingly being rewarded, while firms whose economics depend primarily on perpetual increases in hardware spending face a higher burden of proof. This is a familiar pattern. During the internet buildout, early profits accrued to fiber, networking and infrastructure providers. Over time, economic value migrated toward companies capable of controlling network access, monetizing traffic and building applications on top of that infrastructure. AI may follow a similar path. Falling token costs and improving inference efficiency should gradually shift profit pools toward hyperscale cloud platforms and eventually toward software and application businesses. Hardware remains strategically important, but its beta increasingly depends on the rate of acceleration in AI capital spending. If capex growth merely stays high rather than accelerating, the market can still compress hardware multiples. For investors, this is the difference between buying the shovel manufacturer and buying the business that eventually learns how to turn the mine into cash. China: A Slower Economy With Fewer Easy Policy Answers China’s economy remains in a long-cycle slowdown, even though the pace of deterioration has moderated. New-economy sectors are providing some support, but traditional growth engines continue to weaken. Infrastructure investment fell 2.4% year to date, manufacturing investment declined 1.2%, and real-estate development investment dropped 18.0%. Housing starts, completions and developer funding each recorded declines exceeding 20%. Property is therefore not simply one weak sector; it continues to transmit weakness into construction materials, household appliances, furnishings, local-government finance and consumer confidence. Consumption also remains soft. Trade-in subsidies are producing diminishing returns, while households remain cautious because of uncertainty around employment, property wealth and long-term income. Services are comparatively stronger, but discretionary goods, autos, appliances and dining remain weak. Exports have been a major offset, helped by global demand, AI-related capital expenditure and manufacturing supply-chain strength. Yet reliance on exports creates its own vulnerability because external demand cannot indefinitely compensate for weak domestic balance sheets. Policy remains defensive rather than reflationary. Authorities are emphasizing industrial upgrading, domestic demand stabilization, social support and risk containment. Incremental stimulus is more likely if growth falls materially below targets for multiple quarters or if unemployment, debt stress or an external shock worsens. Until then, policy appears designed to keep the floor from collapsing rather than to lift the ceiling. Bonds: China’s Ultra-Long Duration Still Has Relative Value China’s government-bond market remains supported by weak domestic demand, slowing credit creation and expectations of further monetary accommodation. In July, the curve bull-flattened as long-end yields declined while the short end adjusted more modestly. The 30-year government bond yield fell below 2.2%. Credit spreads generally widened, and three-year AA+ yields in property, steel, coal, power and construction moved to approximately 1.85%, 1.81%, 1.74%, 1.74% and 1.79%, respectively. For the third quarter, we expect yields to remain more likely to fall than rise, but the room for a dramatic rally is limited by countercyclical policy support. A reasonable range is approximately 1.65%-1.70% for the 10-year government bond and 2.15%-2.20% for the 30-year. The most interesting relative-value signal is at the ultra-long end. The 30-year/10-year yield ratio is
Is This Finally Gold’s Turning Point? Why the Recent Rally Looks More Like Rotation Than a New Bull Market
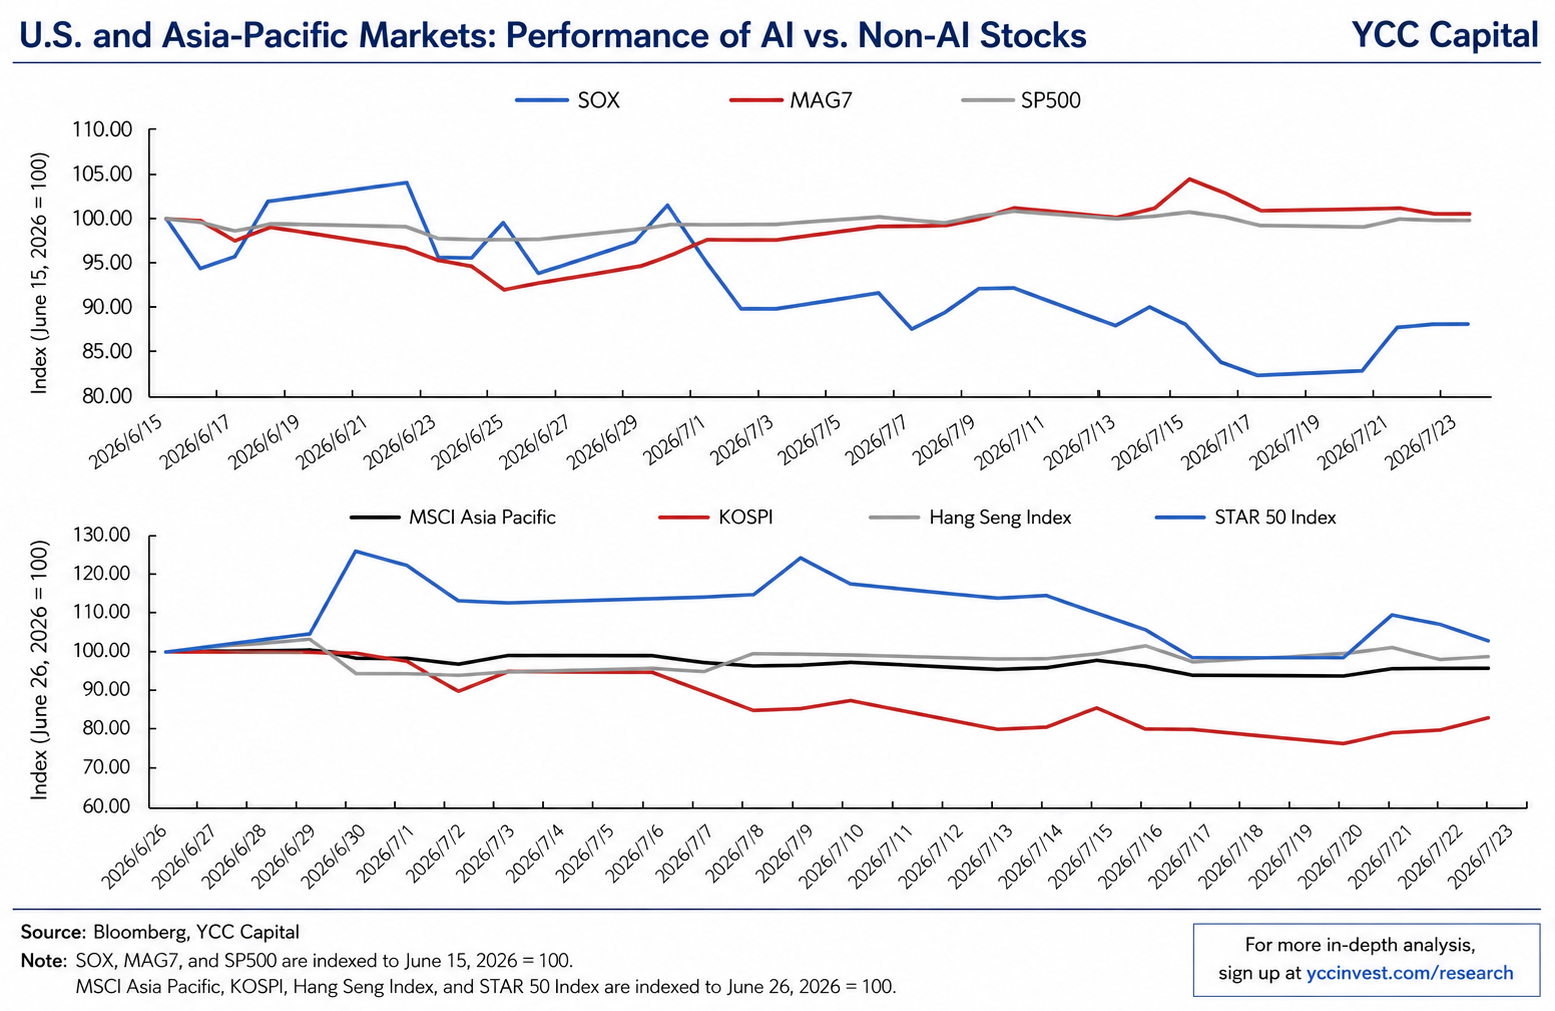
July 25, 2026 YCC Perspective Markets rarely move in straight lines. Like traffic during rush hour, capital often slows in one lane before accelerating into another. Over recent weeks, investors have watched precisely this phenomenon unfold. Money has rotated away from some of the market’s biggest AI hardware winners and into areas that had lagged for months—including precious metals. The temptation is to interpret gold’s rebound as the beginning of another powerful bull market. We believe that conclusion is premature. Instead, current price action appears to reflect tactical portfolio rebalancing rather than a decisive change in the macro regime. Gold has undoubtedly regained investor attention, but the structural catalysts that historically sustain major advances remain only partially in place. The distinction matters. Tactical rallies can be profitable, but strategic bull markets require fundamentally different drivers. A Market Defined by Rotation Rather Than Panic Since late June, global equity markets have undergone one of their sharpest style rotations this year. The immediate catalyst was an aggressive correction across AI hardware stocks. Deleveraging in Korean equities combined with widespread profit-taking across semiconductor leaders triggered a broader reassessment of technology positioning. Capital subsequently migrated into several different destinations. In the United States, investors reduced exposure to semiconductor manufacturers while maintaining or increasing allocations to the largest platform companies within the Magnificent Seven. Across Asia, selling pressure spread through Korea, Japan, and technology-heavy Chinese growth indices, while capital simultaneously found its way into Hong Kong technology, defensive sectors, and precious metals. This distinction is important. Markets have not broadly abandoned risk. Instead, investors have become significantly more selective. That difference suggests a rotation rather than a collapse. Precious Metals Suddenly Reappear Against this backdrop, both gold and silver staged an impressive recovery. Beginning around July 20, spot gold advanced roughly 2.6%, while silver—traditionally exhibiting greater volatility—rose approximately 4.5%. Mining equities outperformed even the underlying metals. Major producers experienced double-digit gains within only a few trading sessions, demonstrating how quickly leverage can amplify improving sentiment toward the sector. At first glance, this appears to resemble the early stages of another precious metals bull market. However, market history teaches that sharp rebounds often occur inside longer consolidation phases. The current move still lacks many of the characteristics associated with durable trend reversals. Why Rising Oil Has Not Prevented Gold from Recovering Earlier this year, stronger oil prices became one of the principal headwinds for gold. Higher energy prices reinforced inflation concerns, pushed Treasury yields higher, and encouraged investors to delay expectations for Federal Reserve easing. Those dynamics weighed heavily on precious metals. Recently, however, something changed. Oil prices and U.S. Treasury yields continued rising, yet gold also began appreciating. Rather than signalling an entirely new macro regime, this divergence suggests markets have become less sensitive to incremental inflation fears. Investors increasingly appear to believe that the Federal Reserve has already approached the most hawkish stage of the current policy cycle. When expectations stop becoming more restrictive—even if policy itself remains tight—the headwind facing non-yielding assets like gold becomes considerably less severe. This subtle shift helps explain why precious metals have been able to stabilize despite conditions that previously would have generated significant selling pressure. Technical Signals Remain Inconclusive Despite recent strength, technical confirmation remains limited. Gold has not yet decisively broken the downward trading channel established since late April. Momentum indicators have improved modestly, but they remain insufficient to confirm that institutional investors have broadly repositioned toward the sector. Short-term rallies frequently occur during corrective phases. Only sustained buying accompanied by stronger macro catalysts would transform today’s recovery into a genuine structural uptrend. For now, caution remains warranted. Capital Flows Are Improving—but Only Gradually Flow data paints a similar picture. The world’s largest gold-backed exchange-traded fund, SPDR Gold Shares, experienced a modest increase in holdings during the week covered by the report, rising from approximately 999 tonnes to just over 1,000 tonnes. Likewise, speculative positioning in COMEX gold futures recovered modestly after months of weakness. These developments deserve attention because institutional positioning often leads price trends. Yet the magnitude of these inflows remains relatively small when compared with previous periods that launched sustained bull markets. In other words, investors are beginning to rebuild exposure—but not aggressively. The market is testing conviction rather than displaying it. Central Banks Have Not Yet Accelerated Purchases Another critical pillar supporting gold over recent years has been central-bank demand. Reserve diversification has steadily increased across many emerging economies as monetary authorities sought to reduce long-term dependence on U.S. dollar assets. Recent purchasing data, however, does not indicate a significant acceleration. Official-sector buying remains supportive but broadly consistent with previous trends rather than signalling a renewed wave of accumulation. Without stronger central-bank demand, it becomes more difficult for gold to sustain major upside momentum solely through speculative positioning. Three Catalysts Still Need to Fall Into Place At YCC Capital, we believe three major macro conditions remain essential before gold can enter another lasting secular advance. First, investors must begin questioning AI returns rather than merely AI valuations. Markets have started debating whether spending levels across AI infrastructure are economically justified. This debate has intensified as hardware stocks corrected sharply. Yet capital expenditure announcements continue to suggest that hyperscale technology companies remain committed to expanding AI investment. Google’s decision to modestly increase its 2026 capital expenditure guidance reinforced confidence that the industry’s investment cycle has not yet ended. Meanwhile, Micron shares recovered following the announcement, indicating that fundamental investors continue viewing AI infrastructure as a long-duration growth opportunity rather than a speculative bubble. The next major test will come from earnings and investment plans released by Microsoft, Meta, and Amazon. Should these companies maintain or increase capital expenditure guidance, confidence in the AI investment cycle would likely strengthen once again. That outcome would reduce demand for defensive allocations such as gold. Second, expectations for Federal Reserve easing must strengthen. Although markets have become less concerned about additional tightening, they have not yet embraced an aggressive easing cycle. Current pricing suggests only modest
Gold’s Shakeout Is Not the End of the Bull Market
YCC Perspective Every major bull market eventually faces a moment that tests conviction. For gold investors, June 2026 has been exactly that moment. After climbing relentlessly for more than a year and reaching an unprecedented peak above $5,500 per ounce, gold suddenly suffered one of its sharpest declines in recent history. For many investors, the move felt less like a correction and more like an air pocket. The experience resembles a crowded theater when someone unexpectedly opens a side exit. For a few moments, nobody knows whether to stay seated or rush toward the door. Markets often behave the same way. When positioning becomes crowded, even a modest shift in expectations can trigger a cascade of selling. The critical question now is straightforward: Has the gold bull market ended, or is this simply a violent reset within a larger structural uptrend? Our assessment is that while the near-term technical damage is significant, the long-term macro foundations supporting gold remain largely intact. Executive Summary Key Conclusions Gold experienced a sharp correction in June 2026 after reaching an all-time high of $5,598.75 per ounce earlier in the year. Three simultaneous bearish catalysts drove the decline: Reacceleration of U.S. inflation. Stronger-than-expected labor market data. Capital rotation from defensive assets toward AI-linked growth opportunities. Crowded long positioning amplified the selloff through systematic deleveraging and stop-loss activity. Gold ETFs have experienced continued outflows while speculative net-long futures positioning has declined materially. Technical support has emerged in the $4,100–$4,200 range. Significant overhead resistance remains around $4,450–$4,500. The structural bull-market drivers—including global debt accumulation, reserve diversification, central-bank purchases, and persistent geopolitical fragmentation—remain in place. Weekly Observation Is the Gold Bull Market Over? The international gold market experienced a dramatic reversal during June 2026. Following the extraordinary momentum generated by the 2025 super-cycle rally, spot gold continued climbing into early 2026 and ultimately reached a historic peak of $5,598.75 per ounce in February. However, over the following four months, prices steadily retraced. The most severe phase occurred between June 5 and June 10, when gold declined for four consecutive trading sessions. By mid-June, all gains achieved during 2026 had effectively been erased, returning prices close to levels seen at the end of 2025. For investors who entered near the highs, the decline has been painful. Yet market history suggests that major secular trends rarely move in straight lines. The strongest bull markets often contain the sharpest corrections. Why Did Gold Fall So Quickly? 1. Inflation and Employment Repriced Interest-Rate Expectations The first shock came from the U.S. macroeconomic data. May CPI accelerated to 4.2% year-over-year, the highest reading in three years. At the same time, U.S. nonfarm payrolls increased by 172,000, nearly double market expectations of approximately 88,000. The combination of stronger inflation and stronger employment fundamentally altered market expectations regarding Federal Reserve policy. Interest-rate markets rapidly shifted toward: Higher-for-longer rates. Reduced probability of future easing. Increased probability of renewed tightening. According to market pricing, the likelihood of the Federal Reserve maintaining current rates at the June meeting rose to nearly 99%, while expectations for potential rate hikes later in the year increased substantially. As a result: U.S. Treasury yields moved higher. The U.S. dollar strengthened. The opportunity cost of holding non-yielding assets such as gold increased significantly. Historically, this environment has rarely been favorable for precious metals. 2. AI Became the Market’s Dominant Narrative The second catalyst was investor psychology. Throughout 2024 and 2025, gold benefited from: Recession fears. Geopolitical uncertainty. Fiscal concerns. Reserve diversification. By mid-2026, however, the dominant market narrative shifted toward artificial intelligence. As earnings visibility improved across the semiconductor and AI ecosystem, institutional capital increasingly rotated toward growth-oriented opportunities. Recent global fund-manager surveys showed that long positions in semiconductors ranked among the most crowded trades worldwide, while long-gold positioning declined substantially. Capital that had previously sought safety began pursuing growth. In markets, narratives matter because narratives direct flows. And flows often matter more than valuation in the short run. 3. Crowded Positioning Triggered a Liquidation Spiral The third factor was market structure. The rapid rally earlier in the year created an extremely crowded long position. Initially, gold bulls defended the psychologically important $5,000 level. However, once prices broke below successive support zones around: $4,500 $4,300 $4,200 systematic selling accelerated. The process became self-reinforcing: Price decline → forced liquidation → additional selling → further price decline This dynamic was visible through: Gold ETF outflows. Falling CFTC net-long positioning. Reduced trend-following exposure. Systematic risk reduction across macro portfolios. The result was less a change in gold’s long-term story and more a violent unwinding of excessive optimism. The Road Ahead Near-Term Outlook Gold has begun finding support between $4,100 and $4,200 per ounce. A modest technical rebound emerged following easing tensions surrounding U.S.-Iran developments and a softer U.S. dollar. Nevertheless, the durability of this recovery remains uncertain. A significant volume of trapped positioning now exists between $4,450 and $4,500. Many investors who purchased near these levels may seek to exit on future rallies, creating persistent overhead resistance. Consequently, a rapid return to previous highs appears unlikely in the immediate future. Our base case remains: Stabilization rather than immediate recovery. Range-bound trading rather than a straight-line rally. Continued sensitivity to interest-rate expectations. Why the Structural Bull Case Still Matters Despite recent turbulence, the fundamental pillars supporting gold have not disappeared. Global Debt Expansion Public-sector debt continues to rise across major economies. The long-term sustainability of sovereign balance sheets remains a central macro concern. Historically, gold has performed well during periods when confidence in fiscal discipline deteriorates. De-Dollarization Trends Central banks continue to diversify reserve holdings. While the U.S. dollar remains dominant, reserve managers increasingly seek diversification through: Gold. Regional currencies. Bilateral settlement mechanisms. Gold remains one of the few reserve assets without sovereign credit risk. Central-Bank Purchases Official-sector demand remains a powerful structural support. Central banks have become one of the most consistent sources of gold demand globally. These purchases are strategic rather than speculative, making them less sensitive to short-term market fluctuations. Persistent Geopolitical Risk
The Bank of Japan Just Sent a Warning to the Entire Financial World
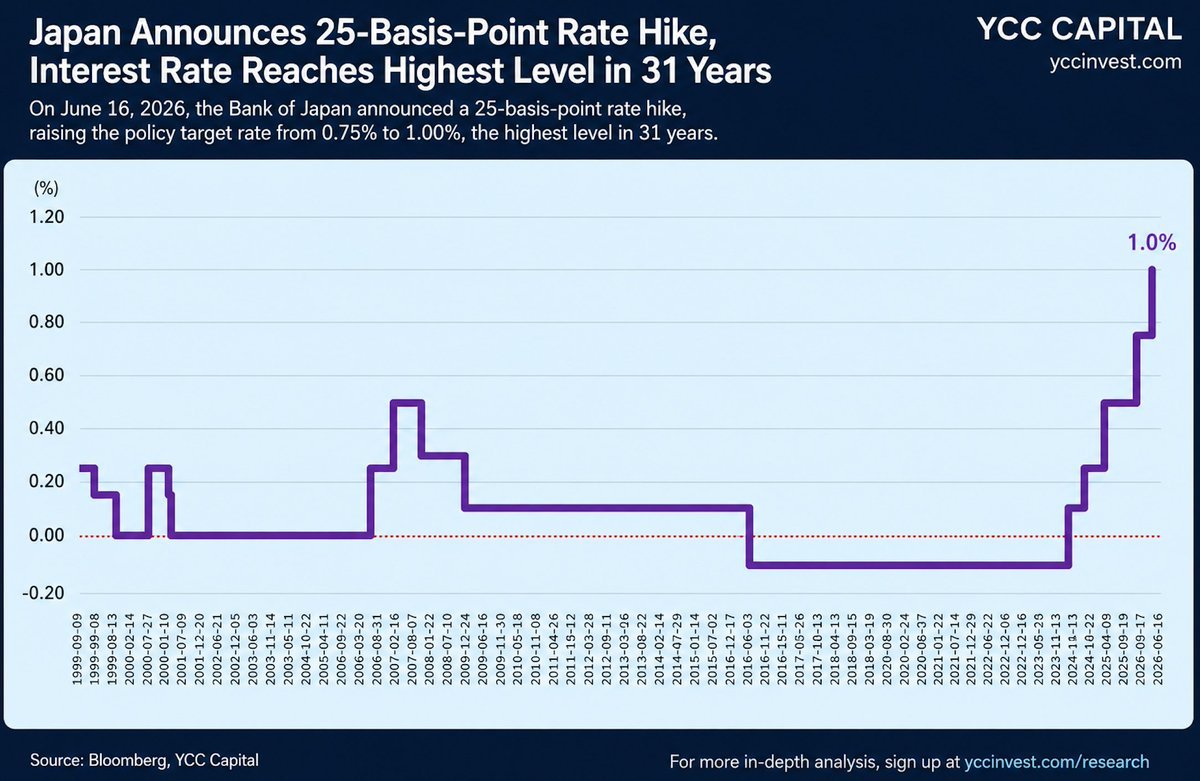
Why the Bank of Japan’s “hike plus pause on QT” is less a hawkish thunderbolt than a careful step on a very narrow bridge Report Date: June 16, 2026 | Source: Bloomberg, YCC Capital YCC Capital Perspective: Japan has crossed a psychological line. A 1.0% policy rate still looks modest by U.S. or European standards, but for Japan it is the end of an era. For a generation, households, banks, insurers, exporters, and global macro investors learned to treat yen funding as financial oxygen: almost free, always available, and rarely questioned. The Bank of Japan is now trying to normalize that oxygen supply without suffocating the patient. That is the central tension of this cycle. EXECUTIVE SUMMARY The Bank of Japan raised its policy target rate by 25 basis points to 1.0%, the highest level in roughly 31 years. Yet the simultaneous decision to slow, and eventually pause, the reduction of JGB purchases softened the tightening message. This was a “rate hike with shock absorbers.” The BOJ tightened the price of money but reassured the bond market that it would not abruptly remove the liquidity backstop. The immediate drivers were imported inflation, energy vulnerability, and yen weakness. Japan remains heavily exposed to Middle East crude flows, while a weak yen magnifies the domestic cost of imported fuel, food, and raw materials. The market reaction shows the ambiguity. The yen remained under pressure while equities rallied, suggesting investors read the BOJ’s move as normalization without a full liquidity withdrawal. The strategic risk lies in the policy contradiction: fiscal expansion meets monetary tightening. Higher rates increase debt-service pressure just as the government leans on stimulus and defense spending. The Policy Decision: A Hike That Came Wrapped in Cushioning After a two-day policy meeting on June 15-16, 2026, the Bank of Japan announced that it would raise its policy target rate from 0.75% to 1.0%. At the same time, it signaled that the reduction in Japanese government bond purchases would not continue indefinitely at the same pace. From June 2026 through the January-March 2027 quarter, monthly JGB purchases are scheduled to decline by roughly JPY 200 billion per calendar quarter. From April 2027, the BOJ plans to pause further reductions and stabilize monthly JGB purchases at around JPY 2 trillion. That combination matters. A pure rate hike says: “conditions are too hot.” A rate hike paired with a pledge to preserve bond-market flexibility says: “conditions are too hot, but the plumbing is fragile.” In practical market language, this was not a Volcker-style hammer. It was a surgeon’s scalpel used while the patient is still moving. The BOJ also retained the option to respond flexibly if long-term yields rise too quickly. That includes increasing JGB purchases beyond the scheduled plan, conducting fixed-rate purchase operations, and providing funds against pooled collateral. The message to the market was therefore deliberately mixed: policy normalization is proceeding, but the central bank will not allow the bond market to seize up if term yields jump too far, too fast. Figure 1. Japan policy target rate reaches 1.0%. Source: Bloomberg, YCC Capital. The Normalization Path Since 2024 Japan’s monetary normalization has unfolded gradually. In 2024, the BOJ raised rates twice, lifting the policy target from the zero-rate zone to 0.25%. In January 2025, it raised rates by another 25 basis points to 0.50%, the largest single increase since 2007. In December 2025, it raised rates again to 0.75%, the highest level since 1995. The June 2026 hike to 1.0% brings the policy rate back to a level not seen for roughly three decades. This is why the headline looks small but the regime change is large. A one-percentage-point policy rate is ordinary in many countries. In Japan, it is like hearing a quiet house suddenly creak at night: the sound itself is modest, but it tells you the structure is moving. Why the BOJ Moved: Imported Inflation Meets a Weak Currency The direct catalyst for the rate hike was the combination of rising imported inflation and renewed energy-price pressure linked to Middle East geopolitical tension. Japan is one of the world’s most energy-import-dependent major economies. As of February 2026, Japan’s dependence on Middle East crude imports exceeded 94%, and imports from Saudi Arabia, the United Arab Emirates, Kuwait, and Qatar alone accounted for more than 90% of total crude oil imports. More than 90% of Japan’s Middle East crude shipments pass through the Strait of Hormuz, leaving the energy supply chain exposed to regional conflict and maritime disruption. The report’s underlying logic is simple: Japan imports energy, Japan imports inflation, and a weaker yen multiplies both. When oil prices rise in dollars and the yen weakens at the same time, Japanese consumers experience a double hit. It is the macro version of buying the same daily convenience-store coffee and suddenly noticing that the price tag has quietly jumped. The CPI debate becomes real when it shows up in routine purchases. Following the outbreak of U.S.-Israel conflict with Iran, shipping through the Strait of Hormuz was effectively disrupted, with many Japan-related vessels stuck inside the Persian Gulf. Although the Japanese government announced an emergency energy diversification strategy and stated that July crude imports would fully avoid the Strait of Hormuz, near-term supply gaps and higher transport costs had already delivered a sharp shock to prices. Producer-price pressure confirms the transmission. Japan’s PPI rose 5.3% year over year in April 2026 and 6.3% in May 2026, the largest increase since March 2023. The rise in raw-material and energy costs has begun to move from corporate transaction prices into broader consumer-price categories. The recent pullback in oil prices after tentative ceasefire arrangements does not remove the macro risk. The agreement is still politically fragile, navigation through the Strait of Hormuz may require a 30- to 45-day observation period before normal operations are fully restored, and core issues such as sanctions, maritime management, and regional military posture remain unresolved. In YCC’s view, oil’s short-term decline is relief, not resolution. The Yen Is the