
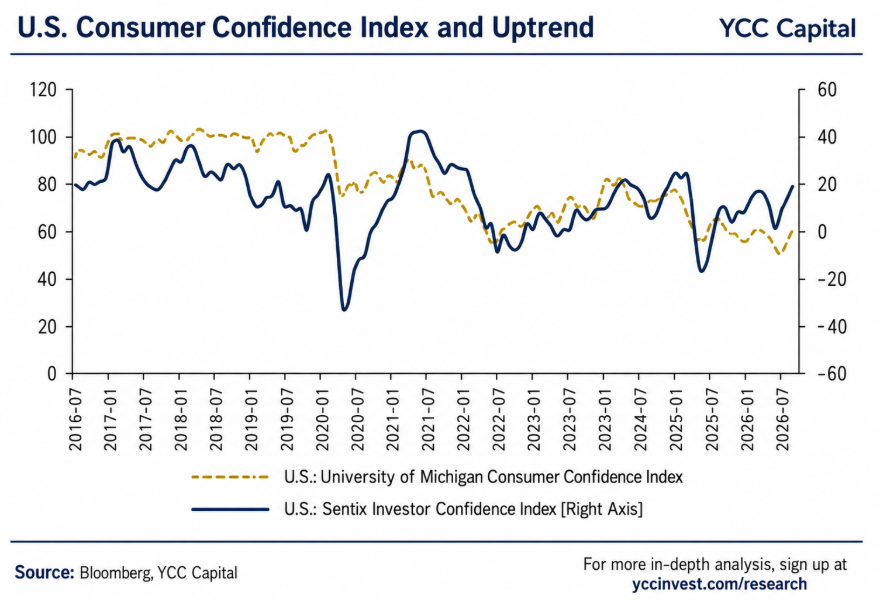
YCC CAPITAL Commodity & Energy Strategy September 2, 2026 The oil market is increasingly being priced not around abundance, but around the shrinking margin for error. That distinction matters. A market can absorb bad news when inventories are comfortable, strategic reserves are deep, and spare capacity can reach consumers quickly. Today, all three cushions look thinner than they did at the start of the year. Our central view is that crude oil remains one of the most important variables in global asset pricing through the remainder of 2026. Even as demand softens, supply security has deteriorated enough that Brent is unlikely to return sustainably to its pre-conflict trading regime. The balance has shifted from “How much oil does the world need?” toward a more uncomfortable question: “How much disruption can the system still absorb?” Source: Bloomberg, YCC Capital Copper Is Still Signaling Resilience in the U.S. Cycle Before turning to oil, copper continues to offer a useful cross-check on the broader macro picture. Historically, copper prices have exhibited a strong negative relationship with the U.S. inventory-to-sales ratio. When inventories are lean relative to sales, economic activity is usually healthier and industrial demand is firmer. Copper has also tended to move in the same direction as global manufacturing PMI. Recent U.S. consumer-confidence readings have remained comparatively resilient, reinforcing our view that the probability of a systematic U.S. downturn remains limited. We remain cautiously constructive on the U.S. economy. Strategic-energy investment, AI-related infrastructure spending, grid upgrades and the continued build-out of electrification demand all create a more durable industrial demand backdrop than headline recession narratives suggest. For copper, that means a deep and sustained correction remains difficult to justify without a material deterioration in U.S. activity or a broader collapse in global manufacturing. Policy developments around U.S. copper tariffs remain important, as does the pace of deliveries into LME warehouses, but the larger message is that the demand base has not disappeared. Oil, however, presents a more acute challenge because the supply cushion is now considerably weaker. Source: Bloomberg, YCC Capital From $68 to $90: The Oil Market’s 2026 V-Shaped Shock Brent crude experienced an unusually sharp V-shaped move between June and August 2026. In June, optimism around a temporary U.S.-Iran understanding encouraged traders to price in easing geopolitical risk. Expectations that traffic through the Strait of Hormuz would normalize helped push Brent back toward approximately $68 per barrel. That optimism proved short-lived. By July, the political foundation of the temporary understanding had weakened. Renewed U.S. maritime restrictions on Iran reversed the market’s assumptions, and Brent surged back toward $90 per barrel. The price action was dramatic, but the more important development happened underneath the screen: inventories were being drained. Since the outbreak of the U.S.-Iran confrontation, observed global oil inventories have declined by roughly 410 million barrels. In July 2026 alone, inventories fell by approximately 69 million barrels. By the end of July, observed global oil inventories had dropped below 7.9 billion barrels, the lowest level since April 2025. This is the equivalent of driving a long mountain road after the fuel-warning light has already come on. The car may still be moving normally, but the room for another wrong turn is much smaller. OECD inventories are now close to levels that materially reduce the market’s operating buffer. That is why relatively small geopolitical developments can create disproportionately large price reactions. Source: Bloomberg, YCC Capital Hormuz Remains the Market’s Narrowest Bottleneck The Strait of Hormuz is central to the current supply risk because more than 30% of seaborne crude oil trade passes through the route under normal conditions. Persistent U.S.-Iran confrontation has sharply reduced effective transit capacity. Before and around the beginning of the conflict in early March, daily ship transits through Hormuz fell from roughly 120 vessels per day to fewer than 10. Conditions briefly improved in late June, when daily tanker transits reached approximately 43 vessels, but the recovery did not hold. From July 10 onward, tanker traffic again remained below 10 vessels per day. During early August, average daily tanker transit fell to only about 1.25 vessels per day. That number is the core of the current risk premium. The problem is not simply whether Middle Eastern producers possess oil underground. It is whether barrels can physically reach the market. Spare capacity trapped behind a geopolitical bottleneck is not economically equivalent to freely exportable spare capacity. Source: Bloomberg, YCC Capital OPEC Supply Has Recovered, but Not Enough OPEC crude production has rebounded from the post-conflict trough, but output remains materially below pre-confrontation levels. In July 2026, OPEC crude production reached approximately 23.63 million barrels per day, up by 4.66 million barrels per day from the 18.97 million barrels per day recorded in May. Yet production remained almost 5 million barrels per day below the roughly 28.5 million barrels per day produced before the U.S.-Iran conflict. This is an important distinction for investors. Headlines describing “OPEC production increases” may sound bearish for crude, but the level matters more than the direction. Recovering from a severe disruption does not automatically mean that the market has returned to normal. Moreover, much of the Middle East’s nominal spare capacity is concentrated around the Persian Gulf, precisely where geopolitical constraints are most acute. Internal OPEC+ differences may further complicate the process of turning theoretical capacity into reliable physical exports. The International Energy Agency estimated global oil supply at roughly 101.5 million barrels per day in July, up about 2.4 million barrels per day month over month, with much of the incremental supply coming from non-OPEC production, including shale and deepwater projects in the Americas. Even so, supply remained approximately 8.3 million barrels per day below year-earlier levels. The estimated third-quarter market deficit widened to roughly 1.8 million barrels per day, compared with an earlier estimate near 800,000 barrels per day. Source: Bloomberg, YCC Capital America’s Strategic Cushion Has Been Drawn Down Aggressively The United States has acted as a critical stabilizer during the disruption, but that role has come at a cost.
Gold’s Second Act: Why the $5,000 Threshold Is Back in Play
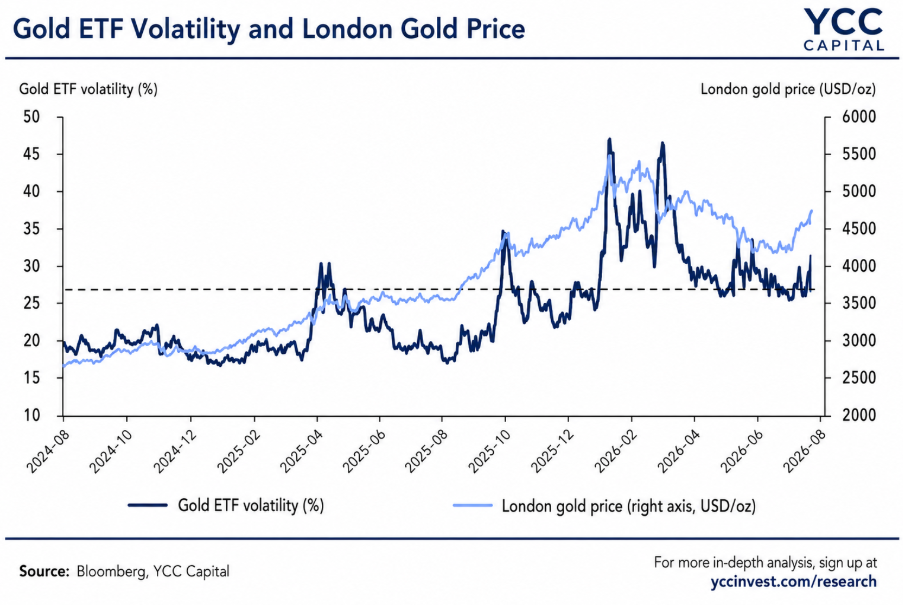
YCC CAPITAL Commodity & Energy Strategy August 28, 2026 YCC Perspective Gold’s 2026 story has been a lesson in the difference between a broken trend and a crowded trade taking a necessary detour. After January’s extraordinary surge, bullion suffered a violent reset. Yet by August, something more important than price itself had changed: gold stopped responding normally to bad news. That matters. Markets often turn before the macro narrative does. Anyone who has watched a resilient business survive a difficult year knows the pattern: the first sign of recovery is rarely spectacular growth. It is simply that the next piece of bad news no longer makes things worse. Gold increasingly looks like that business. Our conclusion is that the current advance should initially be treated as a powerful medium-term rebound rather than an unquestioned new secular leg higher. Nevertheless, positioning is healthier, central-bank demand remains substantial, fiscal concerns have intensified, and the August technical breakout has improved the probability that gold can challenge $5,000/oz. From Euphoria to Reset January represented the opposite of a clean entry point. Gold reached a record above $5,300/oz, while precious-metal volatility surged and silver accelerated dramatically. The gold/silver ratio compressed toward historically extreme territory. Such late-cycle silver outperformance has repeatedly accompanied periods when precious-metal enthusiasm is approaching saturation. The subsequent correction was severe. Gold eventually fell roughly 25% from its January peak, while silver’s drawdown was substantially larger. By late June, bullion had fallen toward the psychologically important $4,000 area. But the correction performed useful work. Speculative exposure declined, volatility compressed and weaker hands were forced out. By late July, gold volatility had fallen toward the lowest levels of 2026. The market entered August carrying considerably less speculative baggage than it had in January. This is the foundation of the current rebound. Why Rising Treasury Yields No Longer Automatically Mean Falling Gold The conventional gold framework is straightforward: gold pays no coupon, so higher real interest rates increase its opportunity cost. A stronger dollar and higher Treasury yields should therefore pressure bullion. That framework is useful—but incomplete. Gold has at least four overlapping identities: a financial asset, a monetary asset, a safe-haven asset and a physical commodity. At different points in the cycle, different identities dominate. History demonstrates the asymmetry. Gold produced positive returns during portions of the 2004–2005 and 2015–2018 Federal Reserve tightening cycles. More recently, bullion began stabilizing in late 2022 even while monetary tightening remained aggressive. Why? Because sufficiently high interest rates eventually create their own counterweight. Higher Treasury yields make gold less attractive as a non-yielding asset, but they also increase Washington’s debt-service burden. The longer yields remain elevated, the more investors are forced to ask whether America’s fiscal trajectory can remain indefinitely painless. U.S. gross federal debt has now exceeded $40 trillion. Interest expense has become one of the largest components of federal spending. Treasury’s August decision to expand buybacks of longer-dated securities may improve market functioning at the margin, but it does not erase the underlying arithmetic. We remain cautiously constructive on the U.S. economy. America retains unmatched capital-market depth, technological leadership and considerable capacity to grow through fiscal pressure. A $40 trillion debt stock is therefore not synonymous with an imminent dollar crisis. But the direction of travel increases the portfolio value of assets carrying no sovereign liability. Gold is precisely such an asset. August Changed the Tape Gold broke above its low-level trading range in early August after spending much of the second quarter digesting January’s excesses. Three forces matter. First, the monetary backdrop became less hostile. The Federal Reserve held rates steady in July, while softer labor-market and inflation readings reduced the immediacy of additional tightening. Gold therefore received relief from the combination of a less forceful dollar and diminishing expectations of near-term rate increases. Second, fiscal anxiety became more visible. Treasury’s decision to expand long-duration bond buybacks arrived as long yields approached multi-decade highs. The immediate market reaction was revealing: yields initially declined and the dollar weakened, while scarce assets benefited. Think of the policy response as putting a stronger pump into a boat taking on water. It can buy time and stabilize the vessel; it does not remove the reason water entered in the first place. Third, investment flows improved. Gold-backed ETF demand strengthened as investors returned after the second-quarter washout. This is important because a rally led only by futures positioning is much easier to reverse than one increasingly supported by strategic allocations. Source: Bloomberg, YCC Capital Central Banks Remain the Structural Bid Official-sector accumulation remains one of the most important differences between today’s gold market and previous cycles. Global central banks bought roughly 289 tonnes in the second quarter, a sharp acceleration from the first quarter. Emerging-market and developing-country institutions continue to play an outsized role as reserve managers diversify assets and reassess geopolitical concentration risk. China has been particularly aggressive. The People’s Bank of China reported approximately 20 tonnes of purchases in July, its largest monthly addition since late 2023, taking reported official holdings to roughly 2,366 tonnes. We would not interpret China’s buying as evidence of broader Chinese economic strength. Quite the opposite: persistent gold accumulation sits alongside weak domestic confidence, subdued physical jewellery demand and an ongoing desire to diversify reserve risk. China’s wholesale gold demand remained soft in July, while high bullion prices and fragile household confidence continued to constrain jewellery consumption. The distinction matters. Chinese official demand is bullish for gold without necessarily being bullish for China. More broadly, gold has become increasingly important in reserve management because it carries no counterparty risk. The dollar remains the dominant reserve currency—its share of disclosed foreign-exchange reserves was approximately 57% in 2026Q1—and we do not expect that dominance to disappear. But reserve diversification does not require the dollar to collapse. It merely requires central banks to decide that holding somewhat more gold makes sense. That process is already underway. The $5,000 Roadmap Gold recently traded around $4,600/oz, leaving the January record above $5,300 some distance away. Yet the
Gold After the Shock: Why Safe-Haven Investing Has Entered a Functional Era
YCC CAPITAL Commodity & Energy Strategy August 12, 2026 Gold’s first-half collapse was not simply a failed inflation hedge or a temporary bout of speculative excess. It was a stress test for the entire architecture of safe assets. After touching a record $5,405/oz on January 29, international gold prices reversed violently, falling to roughly $4,002/oz by the end of June, a drawdown of more than 30%. Volatility rose sharply as markets moved from pricing geopolitical escalation and rapid Federal Reserve easing to confronting stubborn inflation, resilient U.S. growth and a higher-for-longer cost of capital. At YCC Capital, we think the lesson extends far beyond gold. Investors have spent decades using “safe haven” as though it were a single category. It is not. Cash that meets tomorrow morning’s margin call, Treasury bills that can be pledged as collateral, and gold held outside the credit system solve fundamentally different problems. In a genuine crisis, the distinction is similar to the difference between carrying cash, owning insurance and having a spare key: all provide security, but not for the same emergency. The First-Half Gold Shock Was a Repricing of Opportunity Cost The first phase of 2026 was driven by an unusually powerful feedback loop. Geopolitical anxiety, enthusiasm around “de-dollarization” and speculative positioning reinforced one another, producing repeated record highs. Gold set new peaks 12 times before January 29. The market was effectively paying in advance for several highly bullish outcomes at once: escalating conflict, weakening confidence in the dollar and aggressive Fed easing. That combination did not materialize. Instead, U.S. economic activity remained solid and inflation stayed above target. On July 29, the Federal Reserve maintained the federal-funds target range at 3.50%-3.75% by a 9-3 vote, with the three dissenters preferring a 25-basis-point increase. The Fed explicitly described economic activity as expanding at a solid pace while inflation remained elevated. (Federal Reserve) This matters enormously for gold because gold has no yield. Its biggest competitor is not another metal; it is the return available on highly liquid interest-bearing dollar assets. When real yields are attractive, the insurance premium embedded in gold becomes expensive to carry. Investors living through ordinary household finance intuitively understand this trade-off. A safe full of cash may feel comforting, but if a deposit account suddenly pays a meaningful real return, the cost of leaving money idle becomes impossible to ignore. We therefore interpret the first-half selloff as a violent clearing of excessive safe-haven premium accumulated during the previous two years rather than evidence that gold has lost its strategic role. Source: Bloomberg, YCC Capital The Dollar Remains the Liquidity King The fashionable conclusion that rising geopolitical fragmentation must produce a rapidly declining dollar is too simplistic. The dollar remains embedded in the plumbing of global finance. According to the BIS, the dollar was on one side of 89.2% of global foreign-exchange transactions in April 2025, up from 88.4% in 2022. Every one of the ten most heavily traded currency pairs still involved the dollar. (Bank for International Settlements) Reserve data tell a similarly nuanced story. IMF figures show the dollar’s share of allocated official foreign-exchange reserves rose to 57.13% in the first quarter of 2026. The dollar is therefore not experiencing anything resembling an imminent monetary collapse. (IMF Data) The more useful framework is functional segmentation. Dollar cash and Treasury bills remain extraordinarily difficult to replace for immediate payments, collateral and global debt service. Longer-dated Treasuries are different: they introduce significant duration, inflation and term-premium risk. Gold is different again. It cannot compete with dollars for immediate settlement, but it does not depend on an issuer’s promise to repay. China illustrates the limitations of the alternative-currency narrative. Renminbi settlement can create useful redundancy in selected bilateral trade corridors, but China’s capital controls, uneven legal transparency, restricted convertibility and relatively shallow hedging markets constrain the currency’s ability to become a genuine global financing substitute. A payment channel is not the same thing as a reserve ecosystem. We expect Beijing to continue promoting monetary alternatives, but we remain skeptical that these initiatives can materially displace the dollar’s global balance-sheet role over any reasonable investment horizon. Gold Is Institutional Insurance, Not Cash The strongest long-term case for gold is therefore not “the dollar is dying.” It is that increasingly fragmented political and financial systems raise the value of owning an asset with no issuer, no maturity date and no conventional counterparty liability. The distinction became much clearer after the March 2020 Treasury-market liquidity dislocation and the freezing of Russian official reserves in 2022. Both episodes demonstrated that an asset’s quoted value is not identical to its usability during stress. Security now has at least three dimensions. The first is liquidity security: can the asset meet payments, margin calls and debt service immediately? Dollar cash and T-bills dominate here. The second is duration security: can an institution match long-dated liabilities without accepting excessive interest-rate risk? High-quality bonds serve this purpose, but their defensive qualities weaken when inflation and term premiums rise. The third is institutional security: can wealth remain accessible if sovereign, sanctions or legal-jurisdiction risk becomes extreme? Gold has an unusually important role in this layer. That explains persistent official-sector demand. Yet central-bank buying should never be mistaken for an unconditional price floor. When emerging markets face severe currency pressure or dollar shortages, gold itself can be sold to generate liquidity. The reserve asset proves its usefulness precisely because it can be mobilized. Source: Bloomberg, YCC Capital Our Second-Half View: Bottoming First, Repair Later We expect the second half of 2026 to remain volatile rather than develop into a clean bull market. Our base case is a bottoming process during the third quarter followed by a more constructive recovery in the fourth quarter. Near term, the principal obstacle remains U.S. monetary policy. The July FOMC outcome confirmed that policymakers are not in a rush to ease, while three members already favored another hike. That backdrop should keep real rates relatively restrictive and preserve the appeal of cash and short-duration Treasuries. We
After Hormuz: The Real Trade Begins When the Crisis Ends Why the Reopening of the Strait Marks the Start—Not the End—of a New Global Energy Regime
YCC CAPITAL Commodity & Energy Strategy June 29, 2026 Executive Summary Financial markets often celebrate the reopening of a strategic chokepoint as though the crisis itself has disappeared. Yet history rarely works that way. A highway may reopen after an earthquake, but logistics companies, insurers, manufacturers and consumers do not instantly resume normal behavior. Trust rebuilds much more slowly than physical infrastructure. The reopening of the Strait of Hormuz represents precisely this type of moment. The most severe phase of the Middle East energy shock has likely passed, and markets are appropriately removing the extreme tail-risk premium associated with a complete disruption of Gulf oil exports. However, investors should resist equating reopening with normalization. Physical supply chains, shipping confidence, insurance pricing and production capacity all recover on different timelines. From YCC Capital’s perspective, this episode offers three structural lessons that extend well beyond crude oil itself. First, the global energy system proved considerably more resilient than consensus expected. Strategic petroleum reserves, alternative pipeline networks, spare production capacity, expanding U.S. exports and adaptive trade flows prevented an outright breakdown of global oil markets despite one of the world’s most strategically important shipping lanes becoming impaired. Second, geopolitical risk leaves lasting scars. Shipping lanes can reopen overnight on paper, but restoring confidence among insurers, tanker operators and multinational commodity traders is a much slower process. The market is transitioning from pricing catastrophic disruption toward pricing persistent friction. Third, investors should increasingly shift attention away from energy beta toward structural AI alpha. The first phase of the crisis rewarded broad energy exposure. The next phase increasingly favors commodities and economies that benefit from the global AI investment cycle rather than simply higher oil prices. These lessons will likely define asset allocation long after headlines surrounding the Strait of Hormuz fade. The Global Energy System Passed an Unexpected Stress Test Few expected global oil markets to remain as orderly as they ultimately did. Given that nearly one-fifth of internationally traded crude typically passes through the Strait of Hormuz, many forecasts anticipated sustained triple-digit oil prices and severe supply shortages. Neither materialized. The explanation lies in the remarkable flexibility embedded within today’s global energy system. Several supply-side adjustment mechanisms activated simultaneously. Strategic petroleum reserves across major consuming nations were partially released to cushion near-term shortages. Alternative export pipelines bypassing Hormuz absorbed part of the disruption. OPEC producers with available spare capacity modestly increased production. Meanwhile, U.S. crude exports expanded further, reinforcing America’s increasingly important role as the world’s marginal supplier of energy security. Trade routes also adapted more quickly than expected. Importers diversified purchasing toward non-Hormuz sources wherever possible, while refiners adjusted feedstock mixes to maximize operational flexibility. Collectively, these adjustments significantly reduced the effective global supply loss relative to the headline disruption. Importantly, resilience did not originate solely from producers. Consumers also adjusted. High energy prices function much like higher interest rates—they gradually suppress demand. Throughout Asia, petrochemical manufacturers delayed production schedules as feedstock costs climbed. Textile producers reduced operating rates as polyester input prices increased. Airlines faced rising jet fuel expenses that translated into higher ticket prices and softer discretionary travel demand. Even seemingly unrelated industries found creative ways to conserve scarce inputs, illustrating how energy inflation eventually permeates every corner of the real economy. Anyone who has watched a household budget adjust after gasoline prices suddenly jump understands this dynamic intuitively. Families postpone vacations, drive less frequently and delay discretionary purchases. Entire economies behave similarly—only at much larger scale. The simultaneous adjustment of supply and demand explains why the energy shock never evolved into a systemic collapse. Looking ahead, international energy balances could gradually return toward structural surplus conditions if production normalizes as projected. Current industry estimates continue to suggest global supply growth may outpace demand through 2027, limiting the probability of a sustained supercycle in crude prices despite elevated geopolitical uncertainty. Reopening Does Not Mean Recovery Markets naturally respond to headlines. Supply chains respond to incentives. The distinction matters. The recent U.S.-Iran understanding that facilitated the reopening of the Strait substantially reduced the probability of an outright energy catastrophe. Brent crude rapidly surrendered much of its geopolitical premium following the announcement. However, reducing tail risk should not be confused with restoring normal market functioning. Several obstacles remain. Maritime mines must still be cleared. Navigation systems require continuous security verification. Shipping operators need confidence that vessels will not become targets once again. Insurance companies remain cautious, and war-risk premiums rarely disappear immediately after ceasefires. Moreover, temporary political agreements remain exactly that—temporary. The current framework postpones rather than resolves more fundamental disputes surrounding sanctions, nuclear negotiations, maritime security and regional military competition. Consequently, shipping companies are unlikely to immediately return to pre-crisis operating patterns. The experience of the Red Sea offers an instructive comparison. Despite improvements in security conditions, commercial shipping volumes remained well below historical averages for an extended period because confidence recovered much more slowly than physical accessibility. Hormuz is unlikely to prove different. The market must also recognize another overlooked reality. Reopening shipping lanes does not automatically restore production. During the disruption, inventories accumulated rapidly across several exporting regions, forcing temporary production shut-ins. Restarting oil fields is rarely as simple as turning a switch. Older reservoirs requiring water or gas injection may take months to stabilize. Supporting infrastructure—including pipelines, storage facilities, ports, engineering services and specialized labor—must all synchronize before production fully normalizes. Accordingly, we expect oil price volatility to moderate while average price levels remain above pre-conflict norms for an extended period. The era of crisis pricing may be ending. The era of friction pricing is only beginning. Energy Security Is Becoming a Structural Investment Theme One of the most important consequences of the crisis may not be oil prices themselves but rather the strategic decisions governments make afterward. Countries increasingly recognize that dependence upon a single maritime chokepoint represents an unacceptable national vulnerability. The United Arab Emirates has already accelerated efforts to reduce reliance on Hormuz through expanded pipeline capacity and major investments along its eastern coastline.
Oil After the Shock: Why Tight Supply Is Likely to Keep Inflation Elevated Through Year-End
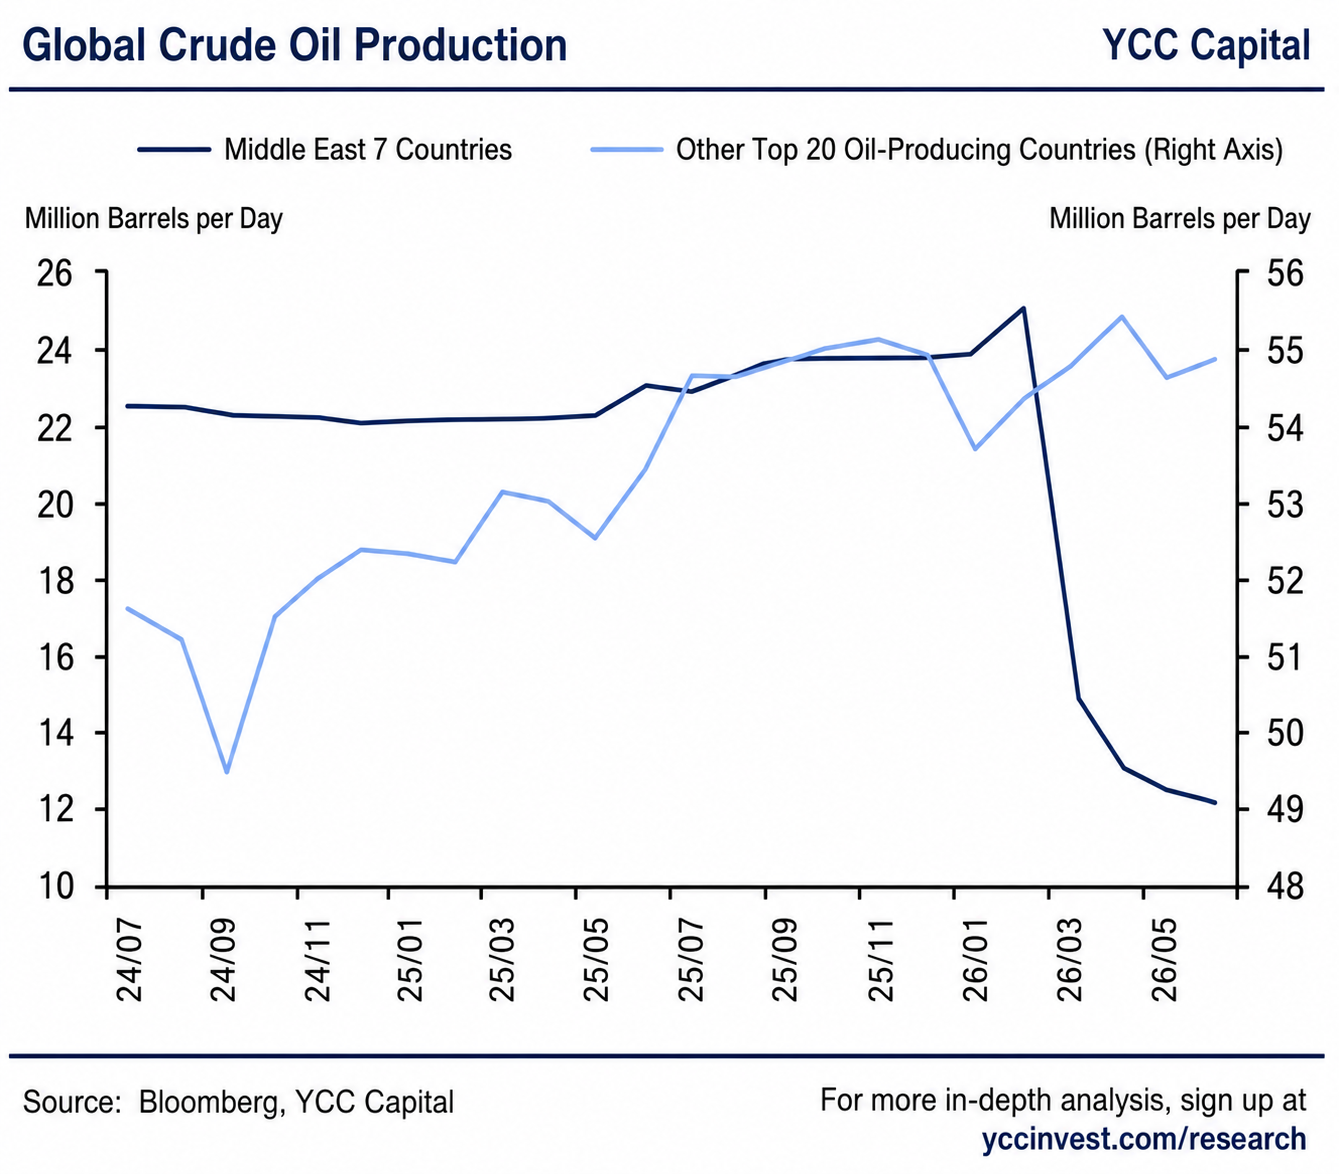
YCC CAPITAL Commodity & Energy Strategy June 27, 2026 Executive Perspective Every major oil shock tells the same story at first glance: prices surge, headlines scream about shortages, and markets brace for recession. Yet history repeatedly reminds investors that the real economic consequences are rarely determined by the initial disruption alone. Instead, they are shaped by what follows—how quickly production returns, how much spare inventory remains, and whether delayed demand eventually re-emerges. The current Middle East supply disruption appears to fit that historical pattern. Although crude prices have retreated significantly from their spring highs, the decline should not be mistaken for a normalization of global energy markets. Much of the apparent resilience has been purchased through extraordinary inventory drawdowns, emergency supply substitution from non-Middle Eastern exporters, and temporary demand destruction caused by elevated shipping costs and record insurance premiums. From YCC Capital’s perspective, investors risk focusing excessively on today’s oil price while overlooking tomorrow’s supply constraints. Physical oil infrastructure cannot simply be switched back on overnight. Damaged wells, transportation networks, export terminals, and storage facilities require months—not weeks—to restore. Meanwhile, inventories that have cushioned markets throughout the first half of the year are steadily being depleted. Like a household relying on its savings account after losing income, the global oil market has managed to avoid immediate crisis by spending accumulated reserves. Eventually, however, those savings become exhausted unless income recovers. The same logic increasingly applies to global petroleum inventories. Our base case therefore remains that crude oil prices will remain structurally elevated throughout the second half of 2026, even if geopolitical tensions gradually stabilize. Why Hasn’t Oil Reached Crisis Levels? The most surprising feature of recent months has not been the supply disruption itself, but rather the market’s relatively orderly response. Since the outbreak of the U.S.–Iran conflict and repeated disruptions around the Strait of Hormuz, roughly one quarter of global seaborne petroleum trade has been affected. Seven major Middle Eastern producers collectively reduced output dramatically, while global oil production fell sharply from pre-conflict levels. Under normal circumstances, such a shock might have pushed Brent crude well above previous historical peaks. Instead, prices briefly approached US$120 per barrel before retreating toward the US$80 range. This resilience reflects three temporary stabilizers rather than any lasting improvement in market fundamentals. Supply Substitution Has Offset Part of the Shock The first stabilizer has been a rapid increase in exports from producers outside the Middle East. North America, Latin America and Eastern Europe have collectively increased crude exports substantially, offsetting roughly half of the lost Middle Eastern supply. Compared with February levels, Middle Eastern exports declined by approximately 324 million barrels by May, while total global exports fell by only 148 million barrels. North America alone contributed nearly 100 million additional barrels of exports during this period, with Latin America and Eastern Europe also expanding shipments meaningfully. The United States has played a particularly important role. American crude exports recently reached record levels while net crude imports fell close to zero, demonstrating the remarkable flexibility of North American energy production. However, this substitution should not be mistaken for unlimited spare capacity. Most major non-OPEC producers are already operating near practical production limits. Incremental supply becomes progressively more expensive as production expands, suggesting that further substitution will become increasingly difficult if Middle Eastern disruptions persist. Source: Bloomberg, YCC Capital Strategic Inventories Have Become the World’s Shock Absorber The second stabilizing force has been unprecedented inventory drawdowns. Rather than allowing domestic shortages to develop, governments have increasingly relied on commercial and strategic petroleum reserves. The United States offers perhaps the clearest example. Since the conflict began, U.S. crude inventories have fallen by approximately 96 million barrels, including over 75 million barrels released from the Strategic Petroleum Reserve (SPR). Reserve levels have now declined to their lowest point since the 1980s. Importantly, this pace of depletion exceeds that observed during the Russia–Ukraine energy crisis in 2022. These releases have allowed American refiners to maintain high utilization rates despite declining imports, preserving gasoline availability and helping stabilize consumer inflation. Japan, China and several OECD economies have adopted similar inventory management strategies. Yet inventories represent a finite buffer rather than a renewable source of supply. Markets often underestimate this distinction. Releasing reserves can smooth short-term volatility, but every barrel withdrawn today represents one less barrel available for future emergencies. The longer geopolitical disruptions continue, the smaller this protective cushion becomes. Demand Has Been Delayed—Not Destroyed The third factor preventing a sustained oil spike has been temporary demand suppression. High crude prices naturally reduce consumption, but today’s weakness appears less like permanent destruction and more like postponed purchasing. Global seaborne crude imports declined approximately 17% between February and May, according to shipping data. China accounted for much of this decline. Imports from seven major Middle Eastern producers fell to their lowest recorded levels, while imports from alternative suppliers increased only modestly. Domestic refinery utilization also weakened noticeably, reflecting delayed downstream demand. However, this should not necessarily be interpreted as a structural collapse in Chinese energy consumption. Instead, Chinese refiners appear to be utilizing existing inventories while waiting for more favorable pricing conditions. Once prices moderate and logistics improve, some of this deferred demand is likely to return. Other Asian importers tell a similar story. Japan, South Korea and Singapore all experienced temporary import declines during the peak of price volatility before gradually rebuilding purchases as markets stabilized. Demand has therefore been shifted through time rather than permanently eliminated. For investors, this distinction matters enormously. Delayed demand frequently returns precisely when inventories are already depleted, creating the conditions for renewed price pressure. Supply Recovery Will Be Much Slower Than Production Shutdowns Markets frequently assume that once geopolitical tensions ease, oil production quickly resumes. History suggests otherwise. Restarting oil production is considerably more complicated than shutting it down. Oil reservoirs depend upon carefully balanced underground pressure systems. Extended shutdowns alter these pressure dynamics, increasing the risk of water intrusion, sediment contamination and declining production efficiency when operations resume. Middle Eastern carbonate
Gold’s Shakeout Is Not the End of the Bull Market
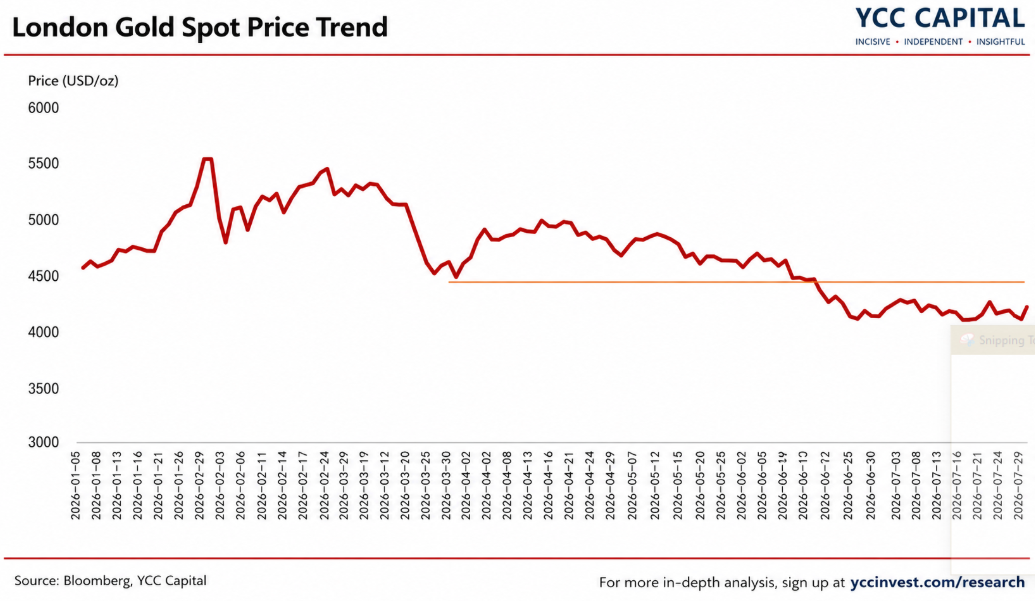
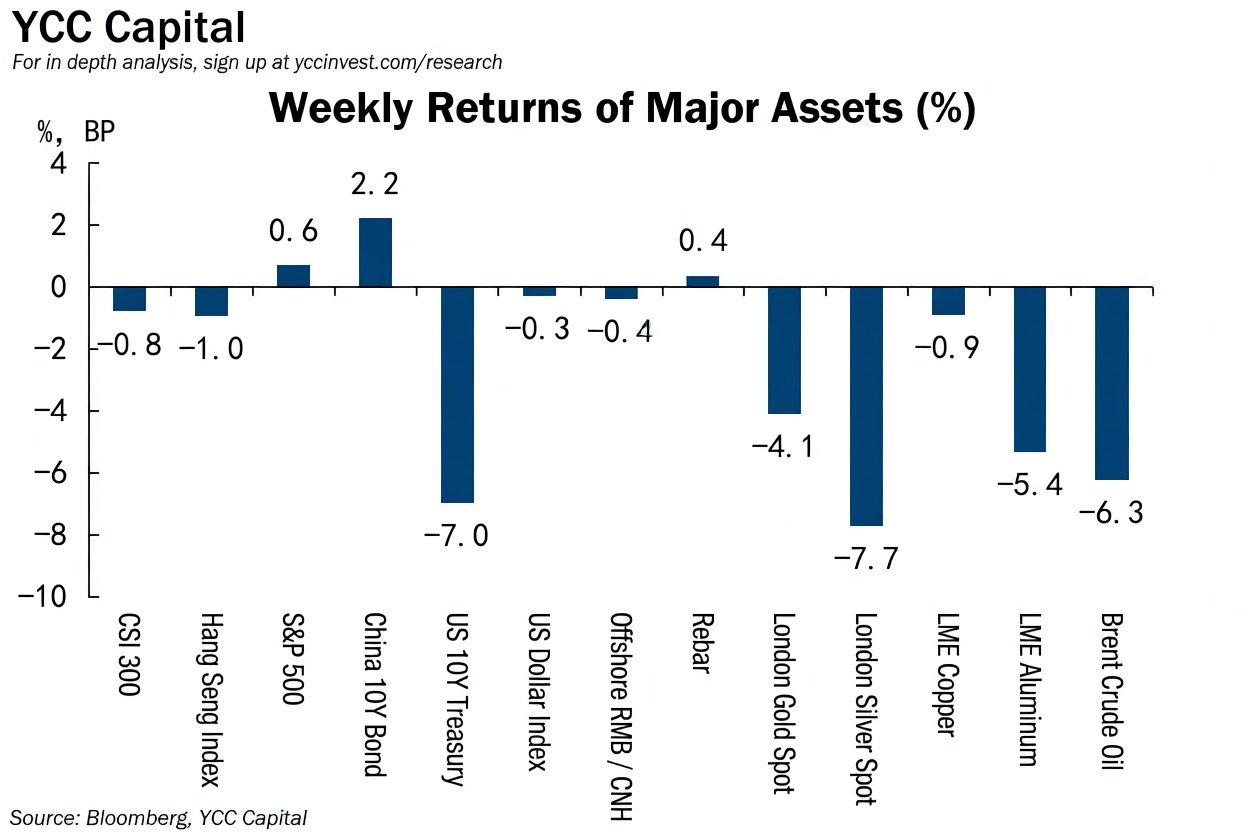
YCC Perspective Every major bull market eventually faces a moment that tests conviction. For gold investors, June 2026 has been exactly that moment. After climbing relentlessly for more than a year and reaching an unprecedented peak above $5,500 per ounce, gold suddenly suffered one of its sharpest declines in recent history. For many investors, the move felt less like a correction and more like an air pocket. The experience resembles a crowded theater when someone unexpectedly opens a side exit. For a few moments, nobody knows whether to stay seated or rush toward the door. Markets often behave the same way. When positioning becomes crowded, even a modest shift in expectations can trigger a cascade of selling. The critical question now is straightforward: Has the gold bull market ended, or is this simply a violent reset within a larger structural uptrend? Our assessment is that while the near-term technical damage is significant, the long-term macro foundations supporting gold remain largely intact. Executive Summary Key Conclusions Gold experienced a sharp correction in June 2026 after reaching an all-time high of $5,598.75 per ounce earlier in the year. Three simultaneous bearish catalysts drove the decline: Reacceleration of U.S. inflation. Stronger-than-expected labor market data. Capital rotation from defensive assets toward AI-linked growth opportunities. Crowded long positioning amplified the selloff through systematic deleveraging and stop-loss activity. Gold ETFs have experienced continued outflows while speculative net-long futures positioning has declined materially. Technical support has emerged in the $4,100–$4,200 range. Significant overhead resistance remains around $4,450–$4,500. The structural bull-market drivers—including global debt accumulation, reserve diversification, central-bank purchases, and persistent geopolitical fragmentation—remain in place. Weekly Observation Is the Gold Bull Market Over? The international gold market experienced a dramatic reversal during June 2026. Following the extraordinary momentum generated by the 2025 super-cycle rally, spot gold continued climbing into early 2026 and ultimately reached a historic peak of $5,598.75 per ounce in February. However, over the following four months, prices steadily retraced. The most severe phase occurred between June 5 and June 10, when gold declined for four consecutive trading sessions. By mid-June, all gains achieved during 2026 had effectively been erased, returning prices close to levels seen at the end of 2025. For investors who entered near the highs, the decline has been painful. Yet market history suggests that major secular trends rarely move in straight lines. The strongest bull markets often contain the sharpest corrections. Why Did Gold Fall So Quickly? 1. Inflation and Employment Repriced Interest-Rate Expectations The first shock came from the U.S. macroeconomic data. May CPI accelerated to 4.2% year-over-year, the highest reading in three years. At the same time, U.S. nonfarm payrolls increased by 172,000, nearly double market expectations of approximately 88,000. The combination of stronger inflation and stronger employment fundamentally altered market expectations regarding Federal Reserve policy. Interest-rate markets rapidly shifted toward: Higher-for-longer rates. Reduced probability of future easing. Increased probability of renewed tightening. According to market pricing, the likelihood of the Federal Reserve maintaining current rates at the June meeting rose to nearly 99%, while expectations for potential rate hikes later in the year increased substantially. As a result: U.S. Treasury yields moved higher. The U.S. dollar strengthened. The opportunity cost of holding non-yielding assets such as gold increased significantly. Historically, this environment has rarely been favorable for precious metals. 2. AI Became the Market’s Dominant Narrative The second catalyst was investor psychology. Throughout 2024 and 2025, gold benefited from: Recession fears. Geopolitical uncertainty. Fiscal concerns. Reserve diversification. By mid-2026, however, the dominant market narrative shifted toward artificial intelligence. As earnings visibility improved across the semiconductor and AI ecosystem, institutional capital increasingly rotated toward growth-oriented opportunities. Recent global fund-manager surveys showed that long positions in semiconductors ranked among the most crowded trades worldwide, while long-gold positioning declined substantially. Capital that had previously sought safety began pursuing growth. In markets, narratives matter because narratives direct flows. And flows often matter more than valuation in the short run. 3. Crowded Positioning Triggered a Liquidation Spiral The third factor was market structure. The rapid rally earlier in the year created an extremely crowded long position. Initially, gold bulls defended the psychologically important $5,000 level. However, once prices broke below successive support zones around: $4,500 $4,300 $4,200 systematic selling accelerated. The process became self-reinforcing: Price decline → forced liquidation → additional selling → further price decline This dynamic was visible through: Gold ETF outflows. Falling CFTC net-long positioning. Reduced trend-following exposure. Systematic risk reduction across macro portfolios. The result was less a change in gold’s long-term story and more a violent unwinding of excessive optimism. The Road Ahead Near-Term Outlook Gold has begun finding support between $4,100 and $4,200 per ounce. A modest technical rebound emerged following easing tensions surrounding U.S.-Iran developments and a softer U.S. dollar. Nevertheless, the durability of this recovery remains uncertain. A significant volume of trapped positioning now exists between $4,450 and $4,500. Many investors who purchased near these levels may seek to exit on future rallies, creating persistent overhead resistance. Consequently, a rapid return to previous highs appears unlikely in the immediate future. Our base case remains: Stabilization rather than immediate recovery. Range-bound trading rather than a straight-line rally. Continued sensitivity to interest-rate expectations. Why the Structural Bull Case Still Matters Despite recent turbulence, the fundamental pillars supporting gold have not disappeared. Global Debt Expansion Public-sector debt continues to rise across major economies. The long-term sustainability of sovereign balance sheets remains a central macro concern. Historically, gold has performed well during periods when confidence in fiscal discipline deteriorates. De-Dollarization Trends Central banks continue to diversify reserve holdings. While the U.S. dollar remains dominant, reserve managers increasingly seek diversification through: Gold. Regional currencies. Bilateral settlement mechanisms. Gold remains one of the few reserve assets without sovereign credit risk. Central-Bank Purchases Official-sector demand remains a powerful structural support. Central banks have become one of the most consistent sources of gold demand globally. These purchases are strategic rather than speculative, making them less sensitive to short-term market fluctuations. Persistent Geopolitical Risk
Asset Divergence Under Repeated Geopolitical Shocks
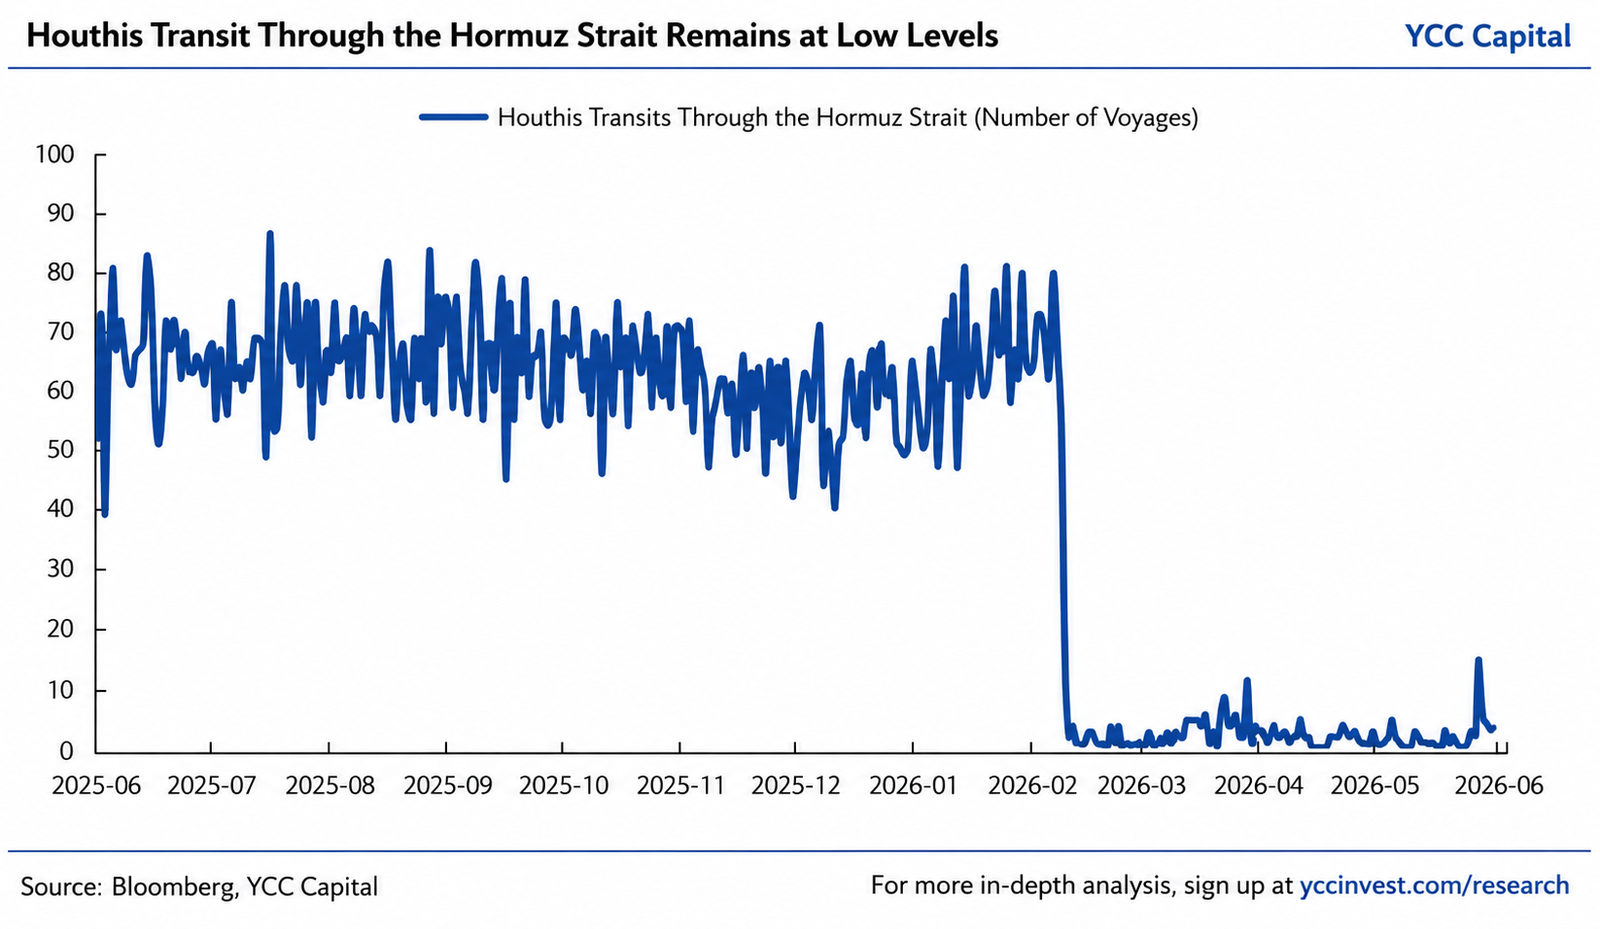
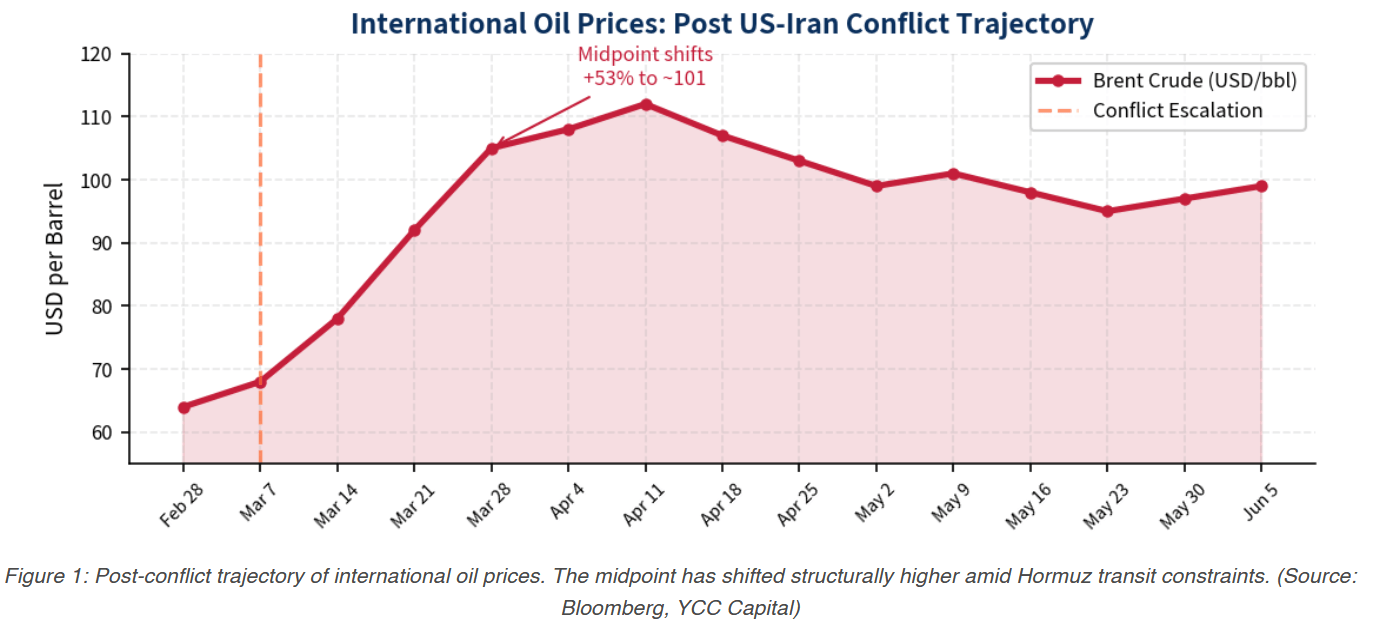
High Oil Prices, Inflationary Pulses, and the Risk of Transatlantic Policy Scissors YCC Perspective: At YCC Capital, our global macro value lens prioritizes capital-flow dynamics and gaps between prevailing narratives and underlying realities. The protracted US-Iran stalemate and depressed shipping volumes through the Strait of Hormuz constitute a textbook geopolitical supply shock. Its transmission into global inflation, central bank policy paths, and cross-asset pricing is asymmetric across economies—particularly relevant for our positioning in Asia and RMB assets, where energy import diversification provides relative insulation compared with more vulnerable regional peers. This analysis dissects the inflationary impulse, the probability of a Fed-ECB policy scissors, and the resulting implications for bonds, equities, and currencies. Key Takeways High oil prices have elevated inflation across multiple economies. The US-Iran conflict has remained locked in a three-month stalemate as of early June. Hormuz Strait daily transit volumes have collapsed to single digits—approximately 5% of pre-conflict levels—with no meaningful recovery. Brent and WTI midpoints have shifted from ~66 USD to ~101 USD (+53%). Energy CPI now exceeds both core and headline inflation in the US (17.9%), Canada (~18%), Eurozone (10.8%), and UK, confirming a potent imported inflation pulse. Japan remains an outlier due to targeted energy subsidies. Energy inflation is likely to create a policy scissors between the Fed and ECB. Eurozone inflation pressures feel more binding: single mandate, higher energy dependence (non-exporter status), and inflation expectations that have spiked to 2022 highs. US dual mandate and resilient domestic energy production afford the Fed greater flexibility. Market pricing implies <1% probability of a June Fed hike versus >90% for an ECB hike. Should the ECB move first, the resulting narrowing of the USD-EUR rate differential would provide tactical support to the euro and cap the DXY. Bond markets face more persistent pressure than equities; FX shows RMB resilience. Over the past three months, global bonds adjusted broadly higher in yield as rate-cut expectations were pared back. Equities exhibited clear bifurcation: Europe and energy-vulnerable markets underperformed while AI-exposed US indices and select Asian markets (e.g., Korea) proved more resilient. Looking forward, we expect the 10Y UST yield midpoint to grind higher. On FX, RMB has appreciated against the USD while JPY, CHF, and EUR depreciated—supported by China’s diversified energy sourcing and export outperformance amid regional supply-chain stress. A policy scissors would likely keep the USD in a wide trading range with mild RMB appreciation bias persisting. Risk factors remain elevated. Further escalation in the Middle East, an oil price spike beyond current levels, or an unexpectedly hawkish Fed reaction function could materially alter the base case. Sources: Bloomberg, YCC Capital analysis. Data as of early June 2026 unless otherwise noted. High Oil Prices Have Elevated Inflation Across Multiple Economies The US-Iran conflict, which erupted earlier this year and entered a protracted stalemate by early June, has now persisted for approximately three months without a durable de-escalation agreement. Throughout this period, maritime transit volumes through the Strait of Hormuz—the critical chokepoint for roughly 20% of global oil trade—have remained severely depressed. Average daily transits have fallen into the single digits, representing roughly 5% of pre-conflict throughput. There are no clear signs of normalization. Constrained supply has kept international crude prices elevated and structurally higher than the pre-conflict equilibrium of approximately 66 USD per barrel. The post-conflict midpoint has shifted to around 101 USD—a 53% increase. This sustained deviation is transmitting directly into global inflation via higher energy input costs, creating a classic imported inflation shock. Energy Inflation Transmission: Cross-Country Evidence In the three months since the conflict intensified, energy CPI has materially outpaced both core and headline measures in most major economies (April 2026 data). The United States recorded energy inflation of 17.9% against headline CPI of 3.8%. Canada saw similar extremes in the 17–20% range. The Eurozone and broader Europe registered energy inflation between 10% and 15%, well above their respective core and headline prints. The United Kingdom followed a comparable pattern. Japan stands apart: its energy CPI remains in negative territory, though the pace of deflation has narrowed meaningfully versus the pre-conflict baseline. This divergence largely reflects Japan’s aggressive fiscal response—most notably the 3.11 trillion JPY supplemental budget that established a dedicated Middle East emergency energy reserve to cushion domestic price pass-through. Without such buffers, the inflationary impulse would likely have been more uniform globally. The key takeaway is that a geopolitically induced oil price regime shift—rather than a transitory spike—has already embedded a durable inflationary pulse into multiple large economies. This is not merely a headline effect; it is feeding into core inflation expectations and, critically, into central bank reaction functions. Markets are now pricing higher-for-longer policy rates in several jurisdictions, with the Euro area appearing particularly sensitive. Energy Inflation and the Emerging US-Europe Policy Scissors Negotiations between the US and Iran have continued in fits and starts. While markets briefly priced in the possibility of an extended ceasefire or de-escalation framework in late May, renewed mutual strikes quickly dispelled that optimism. Key uncertainties persist around any potential extension of the current pause, restoration of Hormuz transit, and the stance of Israel. June’s cluster of global central bank meetings will therefore occur against a highly fluid geopolitical backdrop, with oil prices and negotiation outcomes remaining live variables. Relative to the United States, the European Central Bank faces a more acute inflation challenge. April data showed Eurozone energy inflation at 10.8% and headline CPI at 3.0%—already above the 2% target. US comparables were 17.9% energy and 3.8% headline. While the numerical gaps are not enormous, three structural factors tilt the balance toward greater ECB urgency: Energy dependence asymmetry: The United States is a net oil exporter with substantial domestic production flexibility. The Eurozone remains a large net importer with limited short-term substitution options. Inflation expectation dynamics: Eurozone long-term inflation expectations have surged to levels last seen during the 2022 energy crisis peak. US expectations, by contrast, have remained more contained—even below the levels observed during the 2025 tariff-related inflation scare. Institutional mandate differences: The ECB