YCC CAPITAL
Global Strategy
September 8, 2026
YCC Capital Perspective
The global economy increasingly resembles a city where the newest towers are filling with light while entire older neighborhoods remain dim. Artificial intelligence, advanced computing and capital-intensive technology are creating powerful new pockets of growth, but those gains are not spreading evenly across industries, workers or households.
The United States and China both exhibit this “K-shaped” pattern, yet the economic consequences are fundamentally different. In the U.S., AI investment, rising financial wealth and high-income consumption are strong enough to keep aggregate growth resilient despite pressure on small businesses and rate-sensitive sectors. In China, new-economy industries are expanding, but their contribution remains insufficient to offset the contraction in property, construction and other traditional engines.
Our central conclusion is straightforward: America’s K-shaped economy is unequal but still growing; China’s is increasingly constrained by an incomplete handoff between old and new growth models.
China: New Engines Are Growing, but the Hole Left by the Old Economy Is Larger
China’s macro backdrop remains characterized by weak domestic demand, subdued inflation and unusually low interest rates. In the first half of 2026, real GDP expanded 4.7% year over year, yet fixed-asset investment fell 5.7% and retail sales rose only 1.3%. By July, headline CPI inflation was just 0.5%, core CPI was 0.9%, and the seven-day reverse-repurchase rate remained at 1.4%.
Those numbers describe an economy in which supply remains considerably stronger than demand. Lower financing costs have not generated a meaningful revival in household consumption or private investment.
The difficulty is not simply that traditional industries are growing more slowly than high-tech sectors. Property and other old-economy industries historically supported employment, household wealth, local-government revenue and broad domestic supply chains. Their contraction therefore travels through the economy quickly. New industries, by contrast, are more capital- and technology-intensive and create fewer jobs per unit of output.
The employment arithmetic illustrates the problem. In 2023, every RMB100 million of final domestic demand generated approximately 238 jobs in new-economy industries, compared with 308 in old-economy industries and 281 in core mainstream industries. New-economy sectors represented 18.1% of national value added but only 16.6% of employee compensation. Mainstream industries produced 52.0% of value added while accounting for 60.5% of compensation.
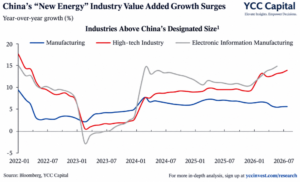
China can produce more advanced machinery, digital services and technology exports without automatically creating an equivalent improvement in household income. That disconnect is central to our cautious view. The new economy is real, but it has not yet developed enough economic mass—or sufficiently broad transmission into household balance sheets—to replace property-led demand.
America: AI Capital Spending Has Become a Macro Force
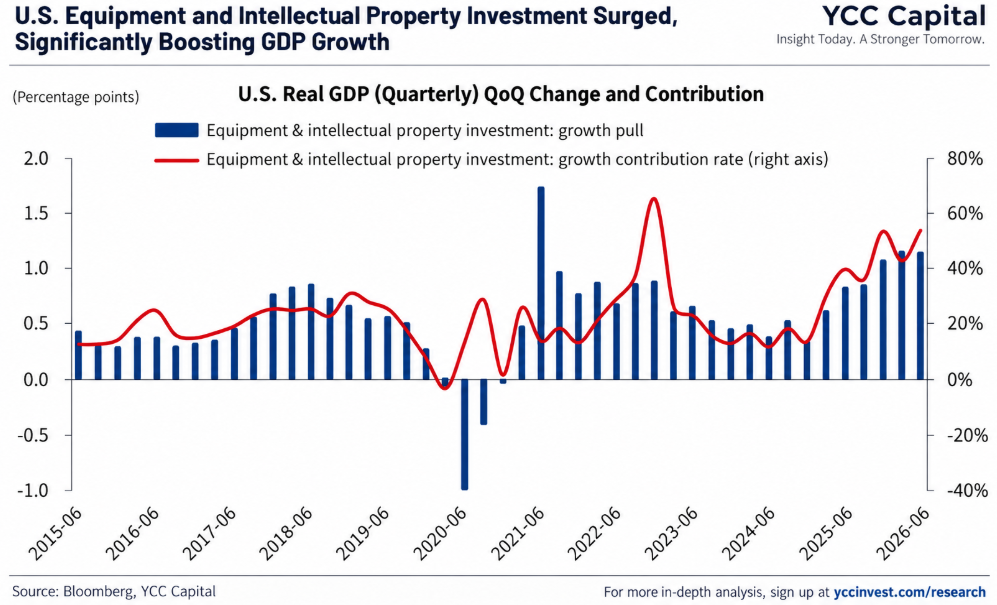
The U.S. version of the K is different because the upper arm is unusually powerful.
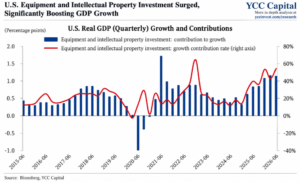
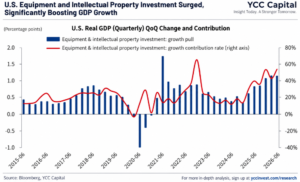
Real U.S. GDP grew 2.1% year over year in the second quarter of 2026. Equipment investment increased 9.6% and intellectual-property investment rose 8.3%; together, the two categories contributed roughly 1.1 percentage points to growth.
AI investment is no longer a narrow technology story. Spending stretches across semiconductors, servers, data centers, cloud infrastructure, software and electricity generation. Large technology companies also possess substantial internal cash flows, making investment less sensitive to interest rates than conventional capital spending.
This matters enormously for the cycle. A small manufacturer deciding whether to purchase machinery at elevated borrowing costs may postpone the decision. A technology platform fighting for leadership in a once-in-a-generation computing transition has a very different incentive. Waiting can be more expensive than capital.
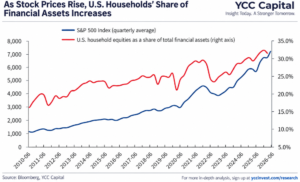
The capital-market channel reinforces the effect. Between 2023 and the first quarter of 2026, U.S. household equity holdings increased approximately 70% and accounted for roughly 60% of the increase in total household assets. Real consumption rose 2.3% year over year in the second quarter, while the household saving rate declined from 5.1% in January 2025 to 2.7% by June 2026.
For investors, this creates an important feedback loop: AI investment supports profits and asset prices; rising financial wealth supports higher-income consumption; that consumption supports aggregate growth.
The Other America Still Feels the Weight of High Rates
Resilience does not mean uniform prosperity.
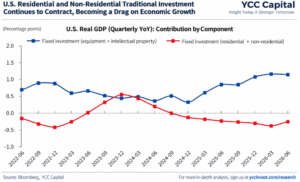
Residential and nonresidential construction investment fell a combined 4.2% year over year in the second quarter, subtracting roughly 0.3 percentage points from GDP growth. Nominal construction spending declined 2.6% during the first half of 2026, with weakness across factories, commercial buildings, hospitals and hotels outside AI-related communications infrastructure.
Small businesses face an even sharper financing disadvantage. Large technology companies can fund investment internally and may even earn substantial interest income on cash holdings. Smaller businesses rely more heavily on bank loans and short-term credit.
The small-business optimism index stood at 95.3 in May 2026, down 4.2 points from December 2025. Businesses with fewer than 250 employees account for roughly 73% of U.S. employment, yet their payroll expansion has been significantly weaker than that of larger companies. Businesses with fewer than ten employees lost about 292,000 workers in 2025.
The K also runs directly through household balance sheets. High-income households benefit disproportionately from equity-market appreciation, while lower-income households experience higher borrowing costs and greater pressure from essential expenses.
Consumer sentiment fell from 60.7 in June 2025 to 51.7 in August 2026 and reached 44.8 in May. Lower-income wage growth has slowed materially: from August 2025 through July 2026, wage growth for the bottom income quartile ran around 3.5%–3.7%, close to its weakest pace since 2016.
Yet we remain cautiously constructive on the U.S. macro outlook. The distributional strains are meaningful, but the upper branch of the K remains strong enough to preserve aggregate momentum.
High Inflation Is Both Symptom and Constraint
U.S. headline CPI inflation stood at 3.4% in July, with core inflation at 2.5%. The federal-funds target range remained 3.50%–3.75%.
This creates a self-reinforcing cycle. AI investment and high-income consumption keep growth firmer than traditional rate-sensitive sectors alone would imply. Stronger demand keeps inflation sticky. Sticky inflation limits the Federal Reserve’s ability to ease aggressively. Higher-for-longer rates then impose additional pressure on small businesses, housing and leveraged households.
It is uncomfortable, but not necessarily recessionary.
China faces almost the mirror image. Weak domestic demand keeps inflation and rates low, while subdued income growth and falling property wealth reduce the effectiveness of monetary easing. America’s problem is that parts of the economy remain hot enough to prevent rapid easing; China’s problem is that easier financial conditions are struggling to revive private demand.
Two K-Shapes, Two Different Fault Lines
China’s divergence is primarily industry-driven. Prosperity differs sharply between emerging technology industries and traditional sectors, and household differences emerge downstream through employment and wages.
America’s divergence is more directly household- and balance-sheet-driven. The same combination of rising equity values, high interest rates and persistent inflation produces dramatically different outcomes depending on whether a household owns financial assets or carries expensive debt.
Nearly 90% of U.S. stocks and mutual funds are held by the wealthiest 10% of households. As equities appreciate, gains therefore accrue disproportionately to households already positioned to spend. Meanwhile, families dependent on wages and credit absorb a larger share of the cost of expensive housing, auto loans, credit cards, food and energy.
That distinction explains why similar technological disruption can generate very different macroeconomic outcomes.
Investment Strategy: Follow the Transmission Mechanism
For the U.S., YCC Capital believes the key mistake would be to interpret visible household stress as evidence that aggregate growth must immediately collapse. AI-related capital expenditure remains capable of supporting investment, corporate earnings and selected consumption channels. We favor a cautiously optimistic stance while recognizing that sticky inflation and elevated rates can continue producing sharp sector-level divergence.
China presents a more difficult setup. High-tech manufacturing and digital industries can produce impressive headline growth without repairing the household balance sheet or replacing the employment intensity of property and traditional industries. Until income expectations, housing wealth and private domestic demand improve convincingly, we view technology-led strength as a structural bright spot inside a fundamentally weak macro transmission mechanism rather than evidence of a durable aggregate recovery.
The K-shaped economy is not merely an inequality story. It is a map showing where an additional dollar of investment, wealth or income actually travels. In America, enough of those dollars still circulate back into demand to keep the expansion alive. In China, too many remain trapped in productive capacity without reaching households.
Source: Bloomberg, YCC Capital
Editorial Board
Ken Cao, Chief Strategist, Global Investment Strategy; Le Gao, Managing Analyst; Yui Nabeshima, Strategist; Mai Ikeda, Research Analyst.
IMPORTANT DISCLAIMER
This research report is provided for informational and educational purposes only and does not constitute an offer to sell or a solicitation of an offer to buy any securities, financial instruments, or investment products. It is not intended as investment, legal, accounting, or tax advice and should not be relied upon as such. The views, opinions, and projections expressed herein are those of YCC Capital Management and its research personnel as of the date of publication and are subject to change without notice. Past performance is not indicative of future results.
YCC Capital Management, its affiliates, principals, and employees may hold long or short positions in securities or instruments discussed in this report and may trade for their own accounts or for client accounts in a manner inconsistent with the recommendations herein. This report is based on publicly available information and data believed to be reliable, but YCC Capital makes no representation or warranty, express or implied, as to the accuracy, completeness, or timeliness of such information. Forward-looking statements involve risks and uncertainties that could cause actual results to differ materially from those projected.
Recipients of this report should conduct their own independent due diligence and consult with their own financial, legal, and tax advisors before making any investment decisions. YCC Capital accepts no liability for any loss or damage arising from the use of or reliance on this report or its contents.
This report is intended solely for the use of the intended recipient(s) and may not be reproduced or redistributed for commercial purposes without the prior written consent of YCC Capital. © 2026 YCC Capital. All rights reserved. YCC Capital’s flagship vehicle, the YCC International Value Fund, LP, maintains a concentrated global macro value strategy with a focus on capital-flow-driven mispricings and asymmetric hedging opportunities. The Fund is registered in the State of Delaware, U.S and structured as a 506(c) fund. Performance data, where referenced, has been verified by independent third parties including NAV Consulting; however, individual investor results may vary.
Contact Us
For research inquiries, contact ir@yccinvest.com. Sign up for free daily market insight at yccinvest.com.
YCC CAPITAL | Global Strategy
YCC Capital Research | Sign up for free daily market insight at www.yccinvest.com
For more related research:
Two Economies, Two K’s: China’s Weak Domestic Loop Meets America’s AI-Led Expansion
America’s Expensive Rebuild AI, Strategic Manufacturing and the Price of Economic Transformation
America’s $40 Trillion Test Treasury Supply, Fiscal Gravity and the New Price of U.S. Credibility
The Era of the Creditless Recovery: Why China’s New Economy Is Breaking the Old Financial Cycle