YCC CAPITAL
Global Strategy
September 8, 2026
YCC Capital Research
The global AI investment boom is creating prosperity, but it is not distributing that prosperity evenly. Both the United States and China increasingly resemble K-shaped economies: technology-intensive industries are moving upward while traditional sectors, smaller businesses, and selected household groups remain under pressure.
Yet the similarity ends there.
In China, the divide is principally between industries. New engines such as advanced manufacturing, digital infrastructure, and AI-related production are expanding, but they have not replaced the employment, income, property-wealth, and fiscal contribution once generated by real estate and infrastructure. The result is an economy where productive capacity remains relatively strong while domestic demand remains weak.
In the United States, the divide is increasingly between households and firms. AI capital expenditure and rising financial assets are generating powerful gains for technology companies and wealthier households, while high interest rates and elevated living costs disproportionately burden smaller firms and lower-income consumers.
The distinction matters for investors. America’s K-shaped expansion is uncomfortable but still growth-supportive. China’s version is more problematic because the declining side of the K remains large enough to overwhelm much of the incremental contribution from the rising side.
China: New Engines Are Growing, but the Old Economy Is Shrinking Faster
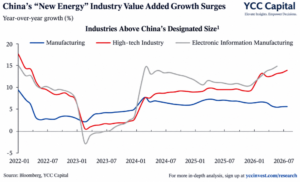
China’s macroeconomic backdrop remains defined by weak demand, low inflation, and low interest rates. During the first half of 2026, real GDP expanded 4.7% year over year, yet fixed-asset investment fell 5.7%, while retail sales grew only 1.3%.
That combination tells an important story. Production continues to outrun demand, and external activity remains healthier than the domestic economy.
In July, headline CPI inflation was only 0.5%, with core CPI at 0.9%. The seven-day reverse-repurchase policy rate remained at 1.4%. Cheap money has therefore not translated into a meaningful acceleration in household spending or private investment.
Low rates are sometimes interpreted as supportive. But rates are also a thermometer. When borrowing costs remain extremely low while credit demand stays weak, the message is often not “abundant opportunity,” but insufficient appetite to borrow.
China’s problem is therefore larger than a simple difference in growth rates between new and old industries. The contraction of property and other traditional engines has already spread through investment, employment, household income, wealth, local-government finance, and business confidence. Meanwhile, the gains from advanced industries have not yet reached the household sector at sufficient scale.
The employment mathematics illustrate the challenge. In 2023, every RMB100 million of domestic final demand generated approximately 238.1 jobs in new-economy industries, compared with 307.9 jobs in old-economy industries and 281.3 jobs in baseline industries.
New-economy industries accounted for 18.1% of national value added, but only 16.6% of employee compensation. Baseline industries represented 52.0% of value added yet 60.5% of employee compensation.
That gap is crucial. China can manufacture more semiconductors, automation equipment, batteries, and digital services without reproducing the employment multiplier once associated with property, construction, and traditional services.
For a household, GDP is an abstraction; the paycheck is not.
This is why we remain cautious on China’s domestic macro outlook. The new economy is real and technologically important, but it is still too capital-intensive, too concentrated, and too weakly transmitted into household income to fully compensate for the retreat of the old growth model.
America: AI Capex Is Powerful Enough to Move the Cycle
The U.S. presents a very different K-shaped structure.
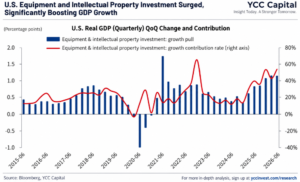
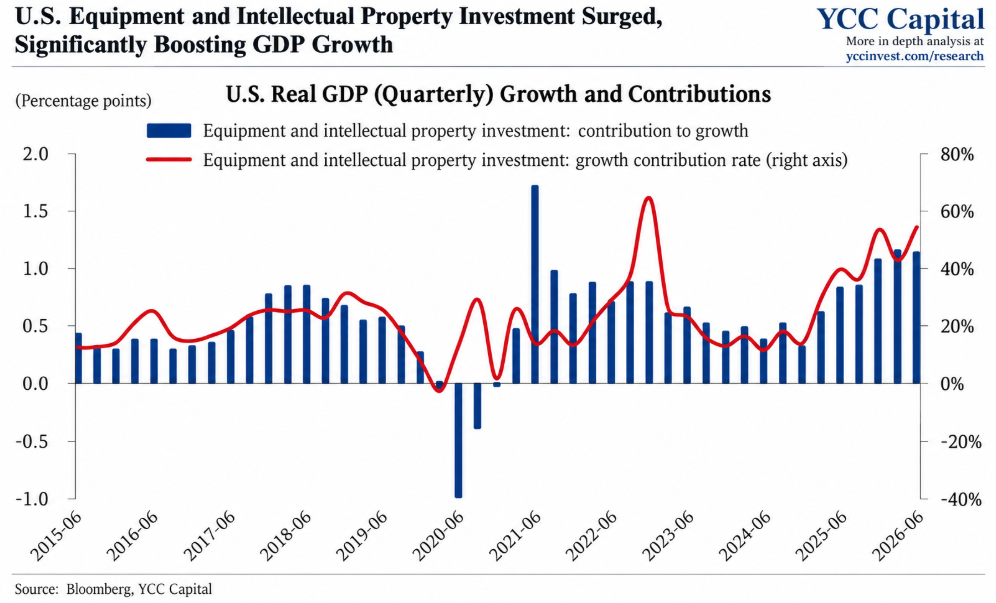
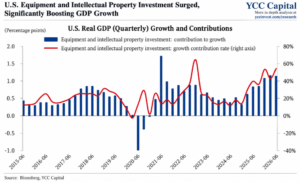
Real GDP expanded 2.1% year over year in the second quarter of 2026. Equipment investment increased 9.6%, while intellectual-property investment rose 8.3%. Together, these categories contributed approximately 1.1 percentage points to economic growth.
This is not a marginal phenomenon. AI investment is becoming a macroeconomic variable.
Major U.S. technology companies continue to spend aggressively on chips, servers, data centers, cloud infrastructure, software, and electricity capacity. Unlike conventional corporate investment, much of this spending is relatively insensitive to interest rates. Competitive pressure, rapid technological change, and the fear of surrendering strategic position can matter more than near-term financing costs.
A company racing to secure leadership in AI infrastructure does not necessarily behave like a property developer calculating whether a project still works after a 100-basis-point move in borrowing costs.
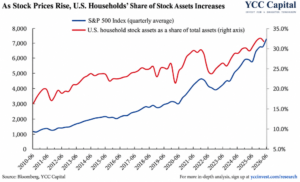
The wealth effect compounds the impact. From 2023 through the first quarter of 2026, U.S. household equity holdings increased approximately 70%, accounting for around 60% of the rise in total household assets.
Consumption has consequently remained resilient. Real consumer spending grew 2.3% year over year in the second quarter of 2026, while the household saving rate declined from 5.1% in January 2025 to 2.7% in June 2026, the lowest reading since June 2022.
The U.S. economy therefore has something China currently lacks: a powerful feedback loop connecting technological investment, financial markets, household wealth, and consumption.
We remain cautiously optimistic on the U.S. economy for precisely this reason.
But America’s Strength Is Unevenly Distributed
The American expansion is resilient, not broad-based.
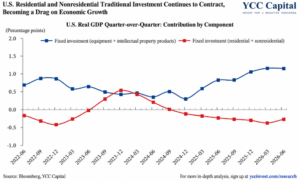
Traditional construction is weak. Residential and non-residential construction investment declined a combined 4.2% year over year in the second quarter, subtracting roughly 0.3 percentage points from GDP growth. Nominal construction spending fell 2.6% during the first half of 2026.
Manufacturing plants, commercial facilities, hospitals, hotels, and other conventional projects have softened, even as AI-related communications infrastructure continues to expand.
Small businesses are also feeling the pressure.
The NFIB small-business optimism index stood at 95.3 in May 2026, down 4.2 points from December 2025. Expectations for hiring, capital expenditure, and sales growth weakened.
Companies with fewer than 250 employees account for roughly 73% of U.S. employment, yet their payroll growth has been only marginal since 2025. Businesses with fewer than ten employees lost approximately 292,000 workers in 2025, almost 4.5 times the employment decline experienced during the 2020 pandemic shock.
High rates are asymmetric. Cash-rich technology companies can finance investment internally and may even earn substantial interest income. Small businesses frequently rely on bank credit, revolving facilities, and shorter-duration borrowing. The same interest rate can therefore be almost irrelevant to one company and existential to another.
The Household Divide Is Even More Visible
America’s K-shaped economy is most evident in consumption.
Consumer spending increased 2.6% in 2025, contributing approximately 1.8 percentage points to GDP growth. In the first quarter of 2026, real consumption rose 2.1%, adding roughly 1.5 percentage points.
But increasingly, affluent households are carrying that spending.
Since the second half of 2025, consumption growth among the top third of income earners has materially exceeded that of lower-income households, with the top 5% showing particularly strong gains.
The stock-market wealth effect explains part of the divergence. Roughly nine-tenths of U.S. equities and mutual-fund assets are owned by the wealthiest 10% of households. Rising technology stocks therefore create substantial spending power, but for a relatively narrow section of society.
Lower-income households face the opposite forces.
The University of Michigan consumer sentiment index declined from 60.7 in June 2025 to 51.7 in August 2026, after touching 44.8 in May, an exceptionally depressed level.
Between June 2025 and June 2026, the share of households expecting unemployment to rise over the following year increased from 39.7% to 41.7%. The share believing they could find another job within three months after becoming unemployed fell from 49.6% to 44.9%.
Wage growth has also weakened disproportionately at the bottom. Between August 2025 and July 2026, wage growth for the lowest-income quartile was only around 3.5%–3.7%, near the weakest levels since 2016.
Among adults with household income below $25,000, approximately 34% could not fully pay the previous month’s bills. For households earning at least $100,000, the comparable figure was only 7%.
America can therefore have strong airport lounges and stressed grocery aisles at the same time. Both are real economies.
Two K-Shapes, Two Investment Conclusions
The difference between the U.S. and China ultimately comes down to transmission.
In China, the K-shape begins with industries. Property contraction damages employment, household wealth, local fiscal resources, and domestic demand. AI and advanced manufacturing generate impressive output but comparatively fewer jobs and weaker household wealth effects.
In the United States, the K-shape increasingly runs through household balance sheets. Rising equities reward asset owners, while high rates punish borrowers. Inflation reduces purchasing power, but affluent households possess both financial assets and stronger income buffers.
The macro outcomes therefore diverge.
The U.S. remains in a resilient-but-unequal expansion. July CPI inflation stood at 3.4%, core CPI at 2.5%, and the federal-funds target range at 3.50%–3.75%. AI investment and affluent consumption continue to support aggregate demand, reducing the urgency for aggressive monetary easing.
China remains in a weak-demand, structurally divided adjustment. The decline of the old economy remains more consequential than the rise of the new one, leaving growth dependent on production, exports, policy support, and increasingly concentrated pockets of technological strength.
Our strategic conclusion is straightforward: AI is not simply creating winners and losers inside markets. It is beginning to alter the economic cycle itself.
In America, AI can currently bend the cycle upward.
In China, it can improve the composition of growth, but it cannot yet repair the underlying demand problem.
Source: Bloomberg, YCC Capital
Editorial Board
Ken Cao, Chief Strategist, Global Investment Strategy
Le Gao, Managing Analyst
Yui Nabeshima, Strategist
Mai Ikeda, Research Analyst
IMPORTANT DISCLAIMER
This research report is provided for informational and educational purposes only and does not constitute an offer to sell or a solicitation of an offer to buy any securities, financial instruments, or investment products. It is not intended as investment, legal, accounting, or tax advice and should not be relied upon as such. The views, opinions, and projections expressed herein are those of YCC Capital Management and its research personnel as of the date of publication and are subject to change without notice. Past performance is not indicative of future results.
YCC Capital Management, its affiliates, principals, and employees may hold long or short positions in securities or instruments discussed in this report and may trade for their own accounts or for client accounts in a manner inconsistent with the recommendations herein. This report is based on publicly available information and data believed to be reliable, but YCC Capital makes no representation or warranty, express or implied, as to the accuracy, completeness, or timeliness of such information. Forward-looking statements involve risks and uncertainties that could cause actual results to differ materially from those projected.
Recipients of this report should conduct their own independent due diligence and consult with their own financial, legal, and tax advisors before making any investment decisions. YCC Capital accepts no liability for any loss or damage arising from the use of or reliance on this report or its contents.
This report is intended solely for the use of the intended recipient(s) and may not be reproduced or redistributed for commercial purposes without the prior written consent of YCC Capital. © 2026 YCC Capital. All rights reserved. YCC Capital’s flagship vehicle, the YCC International Value Fund, LP, maintains a concentrated global macro value strategy with a focus on capital-flow-driven mispricings and asymmetric hedging opportunities. The Fund is registered in the State of Delaware, U.S and structured as a 506(c) fund. Performance data, where referenced, has been verified by independent third parties including NAV Consulting; however, individual investor results may vary.
Contact Us
For research inquiries, institutional discussions, or further information, contact ir@yccinvest.com.
For free daily market insight from YCC Capital, sign up at yccinvest.com.
YCC CAPITAL | Global Strategy
YCC Capital Research | Sign up for free daily market insight at www.yccinvest.com
For more related research:
Two Economies, Two K’s: China’s Weak Domestic Loop Meets America’s AI-Led Expansion
China’s Consumer Mirage: Why Better Employment Data Is Hiding a More Fragile Recovery
The Era of the Creditless Recovery: Why China’s New Economy Is Breaking the Old Financial Cycle
America’s Expensive Rebuild AI, Strategic Manufacturing and the Price of Economic Transformation
America’s $40 Trillion Test Treasury Supply, Fiscal Gravity and the New Price of U.S. Credibility