YCC CAPITAL
Global Strategy
September 4, 2026
The YCC View
The global economy is increasingly being described by averages that conceal more than they reveal. China offers perhaps the clearest example. At the headline level, growth remains positive and advanced manufacturing is expanding rapidly. Beneath that surface, however, the economy is splitting into two very different tracks: AI, electronics and high-end manufacturing are accelerating, while property, traditional consumption and household balance sheets remain under pressure.
That divergence matters because the sectors moving upward are not yet large enough—or labor-intensive enough—to compensate fully for the sectors moving downward. A semiconductor fab can generate extraordinary output with relatively few workers; a housing boom once supported construction crews, furniture stores, appliance manufacturers, local governments and household confidence simultaneously. One engine is technologically powerful. The other was economically broad.
The result is a K-shaped Chinese economy in which industrial sophistication is rising faster than household prosperity. By contrast, the United States is experiencing its own K-shaped expansion, but with a crucial difference: the upward branch, led by AI investment and capital-market wealth creation, has so far been strong enough to keep aggregate growth comparatively resilient.
China: New Engines Are Accelerating
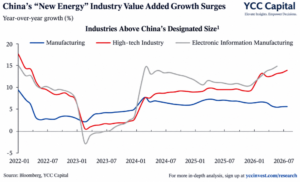
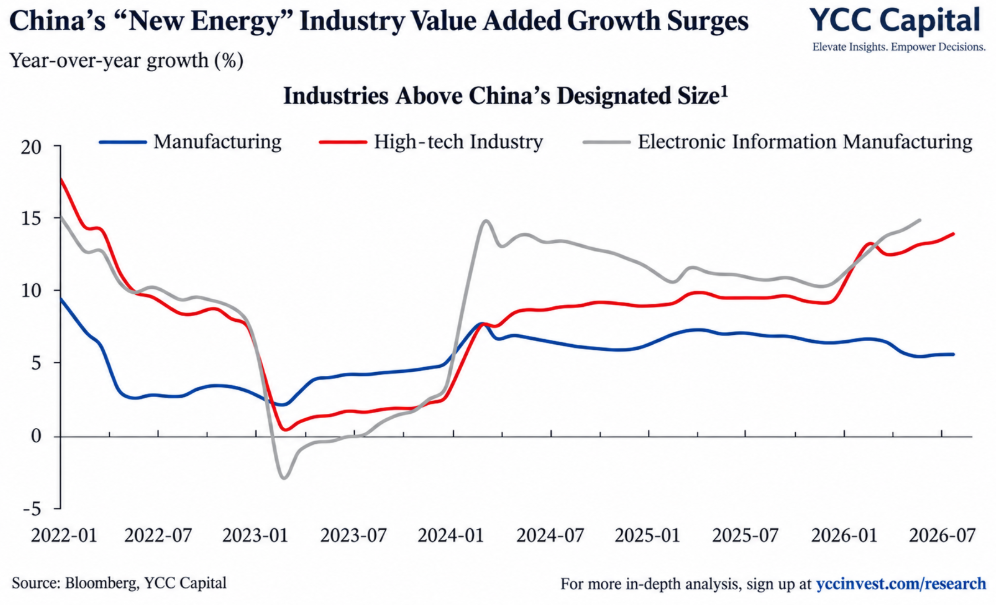
China’s strongest economic momentum is concentrated in advanced manufacturing. During January–July 2026, value added in high-technology manufacturing increased 13.8% year over year, far above the 5.3% growth of industrial enterprises above designated size. High-technology industry investment rose 5.0%, even as total fixed-asset investment fell 6.7%.
July sharpened the contrast. Value added in equipment manufacturing increased 12.3%, high-technology manufacturing rose 16.9%, and digital-product manufacturing expanded 17.3%. Electronics alone contributed 43.7% of the growth in industrial value added. Production of sensors increased 35.3%, memory chips 30.2%, and industrial robots 30.2%.
AI, electronic information and advanced equipment are no longer peripheral stories. They have become central pillars supporting Chinese industrial production.
Corporate profitability shows the same divide. During January–July, total profits of large industrial enterprises increased 17.6%, while profits in high-technology manufacturing surged 50.1%. By comparison, profits in non-metallic mineral products fell 48.2%.
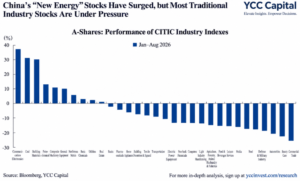
The equity market has been equally unforgiving in separating winners from losers. During the first eight months of 2026, the CSI 300 slipped 0.1%, while the technology-heavy STAR 50 gained 25.3%. Of 31 major Shenwan industries, only ten posted gains. Electronics advanced 36.7% and communications 31.0%, while several traditional consumer sectors—including retail, beauty and automobiles—fell close to or beyond 20%.
In other words, China does have a bull market. It is simply an unusually narrow one.
Exports: AI Is Doing Heavy Lifting
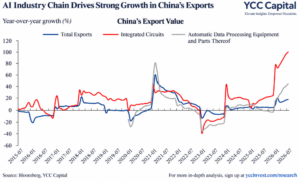
The AI supply chain has also become an important engine of external demand. During January–July 2026, China’s U.S.-dollar exports increased 18.5% year over year. AI-related supply-chain exports reached approximately $582.8 billion, equivalent to 23.1% of total exports, up from 18.6% in 2025.
These exports increased 50.1%, contributing roughly 9.1 percentage points to overall export growth and accounting for approximately 49.4% of the increase in exports.
This is strategically important, but it also exposes the central weakness of the current growth model: some of the strongest demand for China’s new industrial capacity is coming from overseas rather than Chinese households. The factory floor is modernizing faster than the domestic demand engine is healing.
Source: Bloomberg, YCC Capital
The Old Economy Is Still Shrinking
The problem sits most visibly in property.
During the first half of 2026, real-estate industry value added declined 0.2%, while construction value added fell 4.0%. During January–July, real-estate development investment contracted 19.2% year over year. In July, second-hand residential prices across 70 major cities were down 5.4% from a year earlier.
Property’s economic footprint extends far beyond developers. Housing connects steel, cement, chemicals, building materials, appliances, furniture, construction activity, local-government finance and household wealth.
Input-output analysis illustrates why the decline remains so difficult to replace. In 2023, every RMB1 of domestic final demand in old-economy industries generated approximately RMB2.524 of total domestic output, compared with RMB2.282 for new-economy industries. New manufacturing is increasingly productive, but the old growth complex still possesses deeper economic linkages.
It is a little like replacing a department store with a high-end technology laboratory. The laboratory may be more innovative and profitable per employee, but fewer surrounding restaurants, delivery workers and neighborhood businesses necessarily benefit from each dollar spent inside it.
The Household Balance Sheet Remains the Weak Link
Weak property prices are feeding directly into household behavior.
During January–July, retail sales increased only 1.2%. Services performed better, with service retail sales rising 5.0%, while goods retail sales increased just 1.1%. Durable categories such as automobiles, appliances and household furnishings remained particularly soft.
Chinese households are also saving more. The estimated urban household saving rate increased from 33.7% in December 2025 to 36.5% in June 2026.
That behavior is rational. Housing represents roughly half of Chinese household assets. When property prices fall, asset values decline while mortgage obligations do not fall in parallel. Families respond by protecting cash flow and rebuilding balance sheets rather than increasing discretionary spending.
Household leverage consequently declined from 61.5% in Q1 2025 to 57.7% in Q2 2026. Deleveraging may improve financial resilience over time, but during the adjustment it acts as a brake on consumption.
Jobs Reveal the Missing Transmission Mechanism
Headline unemployment does not fully capture the strain.
China’s surveyed urban unemployment rate stood at 5.2% in July, but unemployment among workers aged 16–24 excluding students rose sharply from 14.9% to 17.9%, its highest level since August 2025. Per-capita wage income increased 5.3% in the second quarter, below the 5.8% pace recorded in the fourth quarter of 2024.
This exposes the central problem with the transition toward new growth drivers. Advanced technology sectors are capital- and knowledge-intensive. They can produce impressive revenue, exports and market capitalization without creating employment on the scale once generated by construction, property services and traditional manufacturing.
The missing loop is therefore straightforward: industrial expansion should raise domestic value added, which should raise employment and compensation, which should lift household consumption. China has achieved the first stage more convincingly than the remaining three.
Strong Supply, Weak Demand
At the aggregate level, the divergence remains stark. First-half GDP increased 4.7%, but fixed-asset investment fell 5.7%, while retail sales rose only 1.3%.
Inflation tells a similar story. July headline CPI was just 0.5%, core CPI 0.9%, and the seven-day reverse-repurchase policy rate remained at 1.4%. Cheap money alone has not been sufficient to create strong credit demand.
Our concern is therefore not whether China can manufacture world-class technology—it clearly can. The more consequential question is whether technological upgrading can generate enough household income, employment and domestic spending to offset the contraction of property and associated legacy industries. So far, the evidence remains unconvincing.
Source: Bloomberg, YCC Capital
America’s K-Shaped Economy: Similar Pattern, Stronger Upper Branch
The United States is also experiencing widening economic differentiation, but its configuration is materially different.
The strongest upward force comes from AI-related capital expenditure and buoyant capital markets. The benefits disproportionately accrue to high-income households, owners of financial assets and employees connected to technology-intensive industries. Traditional businesses and smaller companies, meanwhile, continue to feel the pressure of comparatively high financing costs.
Yet the American economy has retained greater aggregate resilience because the scale of investment at the top of the K is powerful enough to support overall activity.
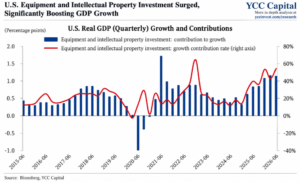
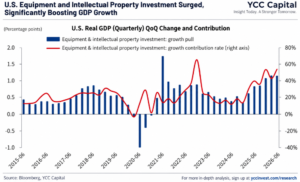
In the second quarter of 2026, U.S. real GDP was 2.1% higher year over year. Equipment investment increased 9.6%, while intellectual-property investment rose 8.3%. Together, the two categories contributed approximately 1.1 percentage points to economic growth.
Since 2025, private fixed investment in information-processing equipment and software has become an increasingly important driver of nominal investment growth. AI is moving from a stock-market narrative into physical capital expenditure: servers, data centers, semiconductors, networking equipment, software and energy infrastructure.
The distinction with China is critical. Both economies are experiencing technological concentration, but the U.S. benefits from stronger household consumption, deeper capital markets and a more powerful wealth-effect channel. We remain cautiously constructive on the United States even as elevated rates create pressure beneath the headline numbers.
Strategic View
China’s K-shaped economy should not be mistaken for a conventional cyclical slowdown. It represents a difficult reallocation between economic models. New productive capacity is expanding rapidly, but the contraction of property carries broader multipliers through employment, household wealth and domestic demand.
For investors, this argues against treating strong Chinese technology exports as evidence of a broad domestic recovery. We favor separating globally competitive industrial niches from the Chinese macro story itself. The former can remain formidable while the latter stays fragile.
In the United States, the AI investment cycle creates concentration risk, but it also produces genuine capital formation and productivity potential. The investment implication is not that every AI-linked asset deserves a premium. It is that the U.S. currently possesses a more effective mechanism for converting technological optimism into investment, household wealth and aggregate demand.
The two economies may both resemble the letter K. The important question is which side of the letter carries enough weight to pull the rest of the economy upward.
Editorial Board
Ken Cao, Chief Strategist, Global Investment Strategy; Le Gao, Managing Analyst; Yui Nabeshima, Strategist; Mai Ikeda, Research Analyst.
IMPORTANT DISCLAIMER
This research report is provided for informational and educational purposes only and does not constitute an offer to sell or a solicitation of an offer to buy any securities, financial instruments, or investment products. It is not intended as investment, legal, accounting, or tax advice and should not be relied upon as such. The views, opinions, and projections expressed herein are those of YCC Capital Management and its research personnel as of the date of publication and are subject to change without notice. Past performance is not indicative of future results.
YCC Capital Management, its affiliates, principals, and employees may hold long or short positions in securities or instruments discussed in this report and may trade for their own accounts or for client accounts in a manner inconsistent with the recommendations herein. This report is based on publicly available information and data believed to be reliable, but YCC Capital makes no representation or warranty, express or implied, as to the accuracy, completeness, or timeliness of such information. Forward-looking statements involve risks and uncertainties that could cause actual results to differ materially from those projected.
Recipients of this report should conduct their own independent due diligence and consult with their own financial, legal, and tax advisors before making any investment decisions. YCC Capital accepts no liability for any loss or damage arising from the use of or reliance on this report or its contents.
This report is intended solely for the use of the intended recipient(s) and may not be reproduced or redistributed for commercial purposes without the prior written consent of YCC Capital. © 2026 YCC Capital. All rights reserved. YCC Capital’s flagship vehicle, the YCC International Value Fund, LP, maintains a concentrated global macro value strategy with a focus on capital-flow-driven mispricings and asymmetric hedging opportunities. The Fund is registered in the State of Delaware, U.S and structured as a 506(c) fund. Performance data, where referenced, has been verified by independent third parties including NAV Consulting; however, individual investor results may vary.
Contact Us
For research inquiries, contact ir@yccinvest.com. Sign up for free daily market insight at yccinvest.com.
YCC Capital Research | Sign up for free daily market insight at www.yccinvest.com
For more related research:
China’s Growth Engine Loses Momentum: Why the Q2 GDP Miss Signals a Longer Road to Recovery
China’s Growth Engine Is Losing Altitude: Exports Still Fly, But Domestic Demand Is Running on Empty
AI’s Reality Check: From Capacity to Cash Flow