
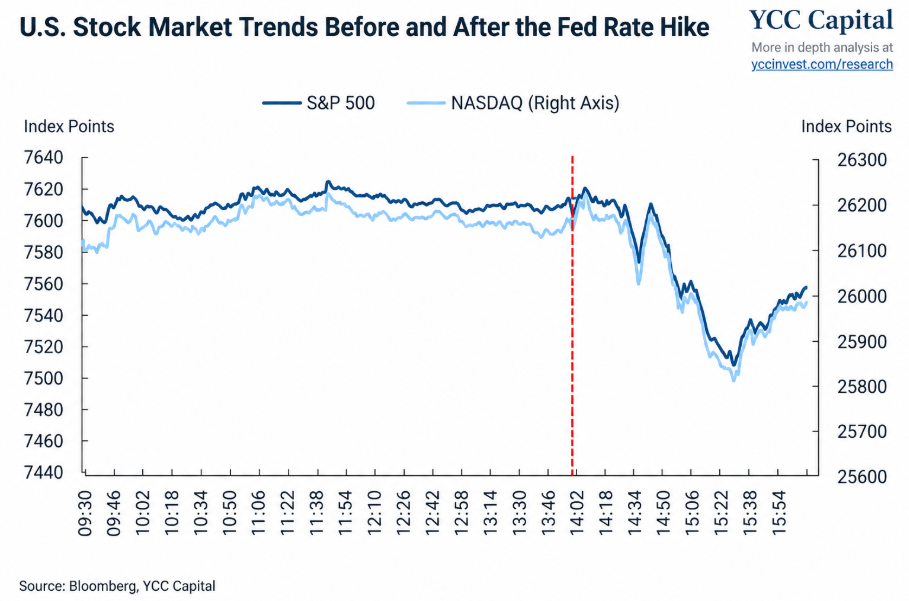
YCC CAPITAL U.S. Bond Strategy September 22, 2026 The Federal Reserve’s September decision matters less for the 25-basis-point rate increase itself than for what it revealed about the reaction function of the new policy regime. The FOMC voted unanimously to raise the federal funds target range to 3.75%–4.00%, but the more important message came from Chair Kevin Warsh: the Fed is not prepared to tolerate a renewed broadening of inflation simply because some of the initial price pressure originates on the supply side. At YCC Capital, we believe markets have underestimated Warsh’s willingness to defend price stability. Investors looking for a predictable sequence—one hike followed quickly by a pause—may be applying yesterday’s playbook to a different central bank. The September meeting suggests policy will remain genuinely data-dependent, and that means both inflation breadth and the economic cost of tighter financial conditions now matter more than comfortable narratives about “normalization.” A Hike Designed to Remove Accommodation The FOMC raised rates by 25 basis points in a 12–0 vote, characterizing the move as removing “a dose of accommodation.” The statement emphasized resilient domestic spending, strong productivity and capital investment, while arguing that tighter policy should produce a more timely return of inflation toward the Fed’s 2% objective. That wording matters. Since July, economic activity and employment have proved firmer than expected, while underlying inflation trends over the summer have shown insufficient improvement. At the same time, geopolitical risks and their potential inflation consequences have complicated the policy outlook. The September dot plot reinforced the hawkish message. Of the 18 officials submitting projections, 16 believed another rate increase would be appropriate before year-end. Twelve projected another 25 basis points of tightening, while four anticipated an additional 50 basis points. The median projected policy rate for both the end of 2026 and 2027 stood at 4.1%. Warsh himself declined to provide a rate forecast and stressed that he would not prejudge future decisions. That combination—a hawkish committee distribution but an intentionally noncommittal chair—makes the next move conditional rather than predetermined. It does not, however, support the comfortable assumption that September was necessarily the final hike. Warsh Is Not the Market’s Messenger The first major conclusion from September is that Warsh’s commitment to price stability appears stronger than markets had assumed. A central bank cannot manufacture oil, natural gas or electricity, and monetary tightening cannot repair supply disruptions. But Warsh made clear that the Fed is concerned about second- and third-round effects—the process through which an initially concentrated price shock spreads into wages, services and broader inflation expectations. This distinction is crucial. The Fed may look through the first spark, but it cannot ignore the fire if it begins moving from room to room. Warsh also pushed back against the idea that markets had forced the Fed’s hand, emphasizing that the decision belonged to the FOMC itself. On political pressure for lower rates, his formulation that central-bank independence is a “two-way street” was equally significant. The institutional message is that independence means neither mechanically resisting political pressure nor accommodating it; policy should instead follow the Fed’s assessment of its mandate. For bond investors, this reduces the usefulness of inferring monetary policy from appointment politics alone. The more relevant variables are inflation persistence, inflation breadth, employment resilience and financial conditions. The Long End Refused to Cooperate The second—and potentially more consequential—lesson was the Treasury market’s reaction. A popular pre-meeting argument held that tighter short-term policy could ultimately push long-term yields lower. Higher policy rates could weaken future growth, reduce future inflation, or accomplish both. Yet that textbook response did not materialize. The two-year Treasury yield rose roughly 13 basis points, while the 10-year yield increased around 7 basis points, flattening the curve. The dollar index gained approximately 0.6%, while the S&P 500 fell about 0.8% and the Nasdaq declined roughly 0.7%. The market therefore traded not the well-anticipated 25-basis-point hike, but the implications of a Fed willing to remain restrictive. The charts accompanying the September market reaction similarly show the post-decision repricing across equities, the dollar, gold and both ends of the Treasury curve. This is where monetary policy collides with fiscal arithmetic. If Fed tightening fails to pull long yields lower, the constraint on the long end may increasingly sit outside the central bank. Persistent fiscal deficits require substantial Treasury issuance. Higher rates also gradually increase federal refinancing costs. Without corresponding fiscal adjustment, rising interest expense can create additional financing needs, potentially lifting term premiums and keeping long-term yields elevated. It resembles a household refinancing a mortgage at a higher rate while continuing to expand its monthly spending: raising the cost of money alone does not repair the balance sheet. Eventually, the financing requirement itself becomes part of the price. For U.S. duration, this means inflation expectations are only one side of the equation. Treasury supply, fiscal trajectories and term premium deserve equal attention. AI Is Becoming a Macro Variable The third message was quieter but strategically important. Warsh acknowledged that the enormous financing requirements associated with artificial intelligence investment can contribute to upward pressure on long-term yields. AI is no longer merely an equity-sector story. Data centers, semiconductors, power generation, transmission infrastructure and associated capital expenditure require extraordinary quantities of capital. When private-sector financing demand expands at the same time that the federal government remains a major borrower, the competition for capital can influence the entire yield curve. Yet the Fed did not pair September’s rate increase with an additional signal of balance-sheet tightening. We interpret that omission as deliberate restraint. With long yields already rising, simultaneously asking markets to price higher policy rates and an accelerated withdrawal of liquidity could have produced unnecessarily severe financial tightening. The Fed retains balance-sheet flexibility, but September suggests it does not currently want to stack every tightening instrument on top of another. What Would Stop the Hiking Cycle? Investors should avoid mechanically extrapolating either the latest inflation print or the latest Fed decision. The appropriate framework is a balance between two policy costs: allowing inflation to
The Fed Raises the Bar: Waiting for the Treasury Yield Peak
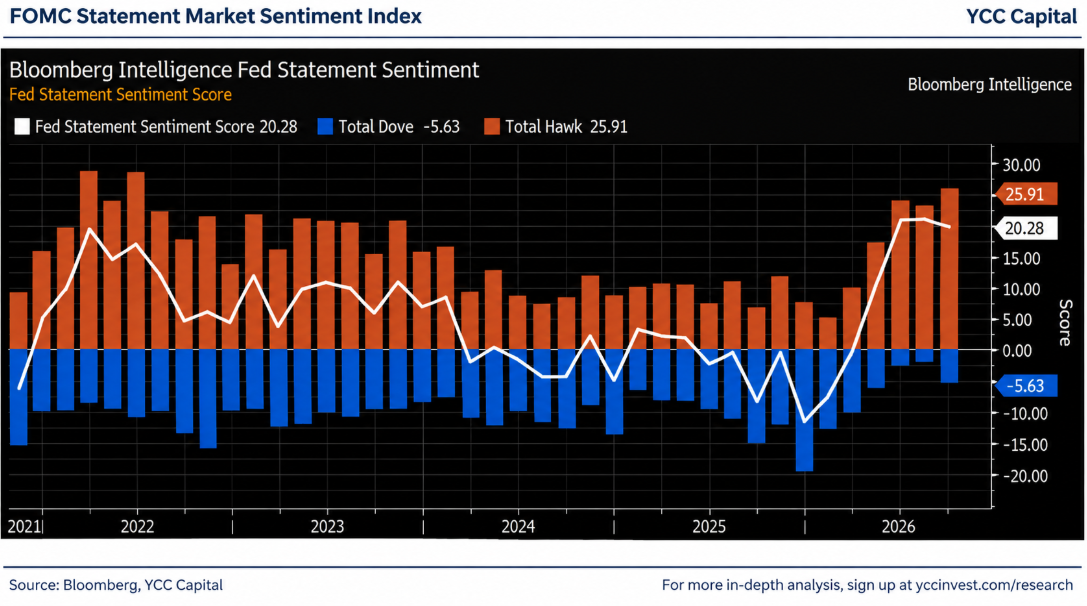
YCC CAPITAL U.S. Bond Strategy September 18, 2026 The Federal Reserve has delivered its first rate increase of 2026, but the more important message is not the 25-basis-point move itself. It is the determination behind it. The FOMC unanimously raised the federal-funds target range to 3.75%–4.00%, explicitly stating that the action should support a timelier return of inflation to 2%. (Federal Reserve) For markets, this is a difficult combination: an economy that remains resilient enough to tolerate tighter policy, inflation still uncomfortable enough to demand it, and geopolitical pressures capable of keeping energy prices elevated. The result is a Federal Reserve willing to keep its foot on the brake even as Treasury yields move into increasingly restrictive territory. Our central conclusion is straightforward: the near-term pressure on Treasuries has not fully exhausted itself, but the higher yields climb, the closer the market gets to the point where tightening begins to create its own counterforce. Investors should be patient rather than chase the selloff. A Hike With a Hawkish Signature The September decision raised the policy range by 25 basis points from 3.50%–3.75% to 3.75%–4.00%. More revealing than the size was the unanimity: the decision passed 12–0. The Fed described domestic spending as resilient, productivity growth as strong, and capital investment as robust, while emphasizing that inflation remains elevated. (Federal Reserve) That language matters. Monetary policy sometimes resembles driving through fog: policymakers cannot see the entire road, but they can decide whether the greater danger is accelerating too quickly or braking too late. September makes clear that the Fed currently sees persistent inflation as the more immediate hazard. The projections reinforce that message. The September Summary of Economic Projections shows policymakers clustering around materially higher policy rates than previously anticipated, while maintaining relatively constructive expectations for economic activity. (Federal Reserve) The underlying macro message is therefore unusual but coherent: higher rates are not yet synonymous with recession. The Fed believes the American economy possesses enough underlying resilience to absorb tighter financial conditions. That distinction is central to our U.S. outlook. We remain cautiously constructive on the longer-term resilience of the U.S. economy, even while recognizing that current rates are becoming increasingly demanding for duration-sensitive assets. The Yield Curve Is Becoming the Pressure Valve Treasury yields have responded accordingly. Federal Reserve data show the 10-year constant-maturity Treasury yield reaching roughly 5.00%, with the 2-year around 4.67%, while long-end yields remain substantially higher still. (Federal Reserve) The rise reflects more than expectations for the overnight policy rate. Three forces are colliding: persistent inflation risk, resilient U.S. growth and capital expenditure, and a geopolitical environment that has elevated the risk premium embedded in energy and long-duration assets. This creates an increasingly important tension. Higher yields initially validate the Fed’s tightening campaign by restraining demand. Eventually, however, they begin doing so much tightening themselves that additional increases become progressively harder for the financial system to absorb. Housing, refinancing, corporate borrowing, equity valuations and federal interest expense all encounter the same higher discount rate. Think of Treasury yields as the water pressure running through the financial system. Raising pressure can improve discipline, but beyond a certain point every weak joint in the plumbing starts to matter. That is why we are increasingly interested in the peak, rather than extrapolating the rise in yields indefinitely. Oil Remains the Macro Swing Factor The next one to two months are likely to be heavily influenced by energy. Geopolitical disruptions have driven Brent crude into roughly the $105–$110 range in the scenario we are monitoring, reflecting overlapping pressures around the Strait of Hormuz, Red Sea shipping routes and attacks affecting energy infrastructure. These forces matter because oil is no longer merely a commodity-market story. It is feeding directly into the monetary-policy debate. The Fed cannot produce a barrel of oil or reopen a shipping lane. What it can attempt to prevent is an initial relative-price shock from spreading into wages, services, expectations and broader inflation. This creates a powerful transmission chain: Geopolitical stress → higher oil → stronger inflation pressure → tighter Fed expectations → higher Treasury yields → tighter financial conditions. The chain can also reverse. If geopolitical pressure stabilizes and crude transitions from a rising trend into a high-level consolidation, the Treasury market would finally gain room to do the same. That is one of the clearest pathways toward a durable yield peak. Two Roads From Here We see two principal mechanisms capable of ending the current Treasury selloff. The first is endogenous. Yields simply become sufficiently high to damage interest-sensitive areas of the economy or financial markets. In that scenario, tightening generates the conditions that eventually suppress yields. The adjustment could be uncomfortable, but it would contain its own stabilizer. The second is external. Geopolitical pressure moderates, energy prices stop climbing and inflation fears cool. That would allow Treasury yields to transition into a high-level trading range without requiring a significant deterioration in U.S. fundamentals. The distinction matters enormously for equities. A yield peak caused by easing inflation pressure is fundamentally different from a yield peak caused by financial stress. At present, we do not believe investors need to make an all-or-nothing bet on either path. Asset Allocation: Protect First, Add Risk Later For Treasury investors, patience remains valuable. The Fed’s September communication does not provide a compelling reason to aggressively front-run lower yields. Yet with the 10-year yield around the 5% area, the compensation available in high-quality U.S. duration has become increasingly meaningful. (Federal Reserve) The opportunity becomes more attractive once evidence emerges that oil and long-end yields are losing upward momentum. For precious metals, hawkish monetary policy remains a near-term headwind. Higher real yields increase the opportunity cost of holding non-yielding assets. Nevertheless, the asymmetric downside is becoming more interesting as nominal yields approach levels that themselves create macroeconomic stress. We would become more constructive when Treasury yields demonstrate clearer signs of peaking. For equities, the appropriate posture is neither indiscriminate defensiveness nor aggressive risk-taking. Higher discount rates remain a valuation constraint, particularly for
The Fed’s Hall of Mirrors: Why Higher Rates Cannot Solve America’s AI Capital Boom
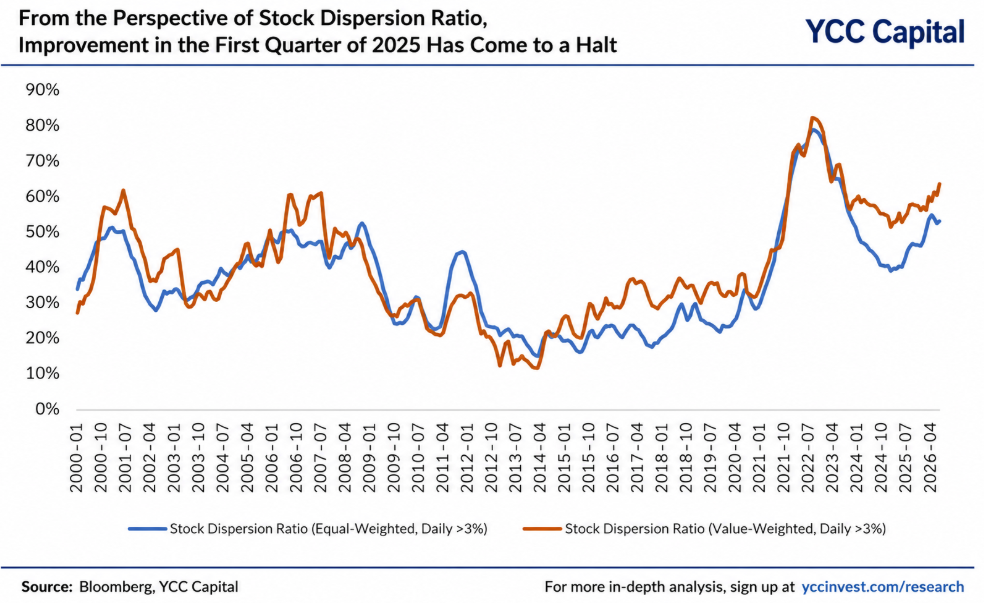
YCC CAPITAL U.S. Bond Strategy September 3, 2026 The most important question facing U.S. monetary policy is no longer simply whether inflation is a few tenths above target. It is whether the Federal Reserve is using a cyclical instrument to confront structural forces that interest rates cannot easily control. Our view is straightforward. If elevated long-term Treasury yields are increasingly driven by genuine demand for capital, while oil reflects supply and geopolitical constraints and artificial intelligence represents a structural investment cycle, raising short-term rates in an attempt to suppress long yields or cool AI spending risks hitting the wrong target. The first casualty would likely be the non-AI economy: housing, manufacturing, consumption, small businesses and other rate-sensitive sectors. AI has become too strategically important for the United States to simply switch off when financing costs rise. That implies sustained capital demand, sustained borrowing requirements and, potentially, structurally higher real rates. The irony is that a Federal Reserve trying to demonstrate discipline through higher rates could eventually find itself forced to provide liquidity through its balance sheet to stabilize Treasury markets and the broader dollar-based financial system. That is the policy contradiction investors should focus on. A Hawkish Framework Is Not the Same as a Hawkish Reaction Function Recent Federal Reserve rhetoric has leaned hawkish, but rhetoric should not be confused with a binding policy path. Inflation breadth remains uncomfortable. Roughly 54% of PCE categories have increased by more than 3% over the past twelve months, while about 49% exceed 3% on a six-month annualized basis. Weighting those categories by their actual share of consumer spending produces an even stronger signal: approximately 63.7% of the consumption basket has experienced inflation above 3% over twelve months, and 60.8% on the six-month annualized measure. For perspective, from 2000 to 2019 the corresponding averages were only about 34.3% and 35.9%. Restricting the comparison to 2015–2019 lowers them further to 30.4% and 32.4%. Inflation diffusion therefore stopped improving around the first quarter of 2025. But the composition matters more than the headline. Much of the excess inflation pressure now comes from financial services and insurance, alongside selected core services and goods. Monetary policy is a remarkably blunt instrument against these categories. Higher policy rates cannot directly reverse compensatory insurance repricing, lower medical prices by decree, restore global goods deflation, or resolve an oil supply shock. Using monetary policy for every problem is rather like adjusting the thermostat when the real problem is a broken window. The room may eventually cool, but the solution is inefficient and someone else pays the heating bill. The Fed and Markets Are Trapped in a Hall of Mirrors The interaction between the Federal Reserve and markets has become increasingly reflexive. Markets attempt to anticipate the Fed. The Fed watches financial conditions and market pricing as inputs into its assessment of the economy. Markets then trade the Fed’s reaction to those same prices. Eventually, communication becomes less a window into the economy and more a mirror reflecting another mirror. This dynamic worked better during periods of macroeconomic stability, when forward guidance helped anchor expectations. Today, wars, supply chains, AI investment and geopolitical realignment can change inflation and growth trajectories within months—or weeks. That makes rigid guidance dangerous. A central bank that promises too much either has to violate its commitment when circumstances change or defend an obsolete commitment at the expense of its policy objectives. Even during the Great Moderation, Federal Reserve projections contained meaningful forecasting errors. Today’s environment is substantially less predictable. Our conclusion is simple: when monetary policy cannot substitute for structural reform, less communication can sometimes be more useful. The Fed should avoid turning every speech into a tradable event, while investors should spend less time parsing adjectives and more time studying capital flows. “Hike Rates to Save the Long End” Is the Wrong Diagnosis One increasingly popular argument holds that additional Fed tightening could lower long-term Treasury yields by reinforcing inflation credibility. That logic can work when inflation expectations are genuinely unanchored. It fits today’s market much less comfortably. Ten-year Treasury yields are around 4.75%, with ten-year real yields near 2.44% and breakeven inflation close to 2.3%. Compare that with August 26, 2022, when Jerome Powell delivered his memorable Jackson Hole warning: the ten-year nominal yield was approximately 3.03%, breakeven inflation around 2.57%, and the real yield roughly 0.5%. Nominal yields are therefore about 170 basis points higher today, but real yields are roughly 200 basis points higher, even though breakeven inflation is lower. The message is difficult to miss. Today’s long-end problem is primarily a real-rate problem, not an inflation-expectations problem. A more hawkish Fed can still compress inflation expectations at the margin, but if expectations are already broadly anchored, the main effect of tighter policy is increasingly transmitted through demand destruction and higher real financing costs. Nor can another 25-basis-point hike resolve oil-market disruptions caused by war, shipping insecurity or geopolitical competition. A policy rate cannot reopen a blocked shipping lane or rebuild military inventories. AI Is Becoming the Marginal Buyer of American Capital The more important structural development is the extraordinary financing appetite of the U.S. AI ecosystem. AI-linked technology companies accounted for approximately 17.9% of U.S. non-financial corporate bond issuance with maturities of one year or longer in 2023. That share rose to roughly 37.9% in 2026. In dollar terms, AI-related corporate bond issuance increased from about $45 billion in 2023 and $48 billion in 2024 to roughly $172 billion in 2025. During just the first eight months of 2026, issuance approached $295 billion—more than the previous three years combined. Source: Bloomberg, YCC Capital. This changes the transmission of monetary policy. The largest AI companies can continue financing strategically essential investment even at elevated rates. Real estate developers, manufacturers, consumers and smaller businesses cannot absorb higher borrowing costs nearly as easily. Raise rates modestly, and AI investment continues while traditional activity weakens. Raise them enough to truly stop AI financing, and large portions of the conventional economy may already be in
The Quiet Hawk: Warsh Wants Markets to Fear the Fed—Without Promising a Hike
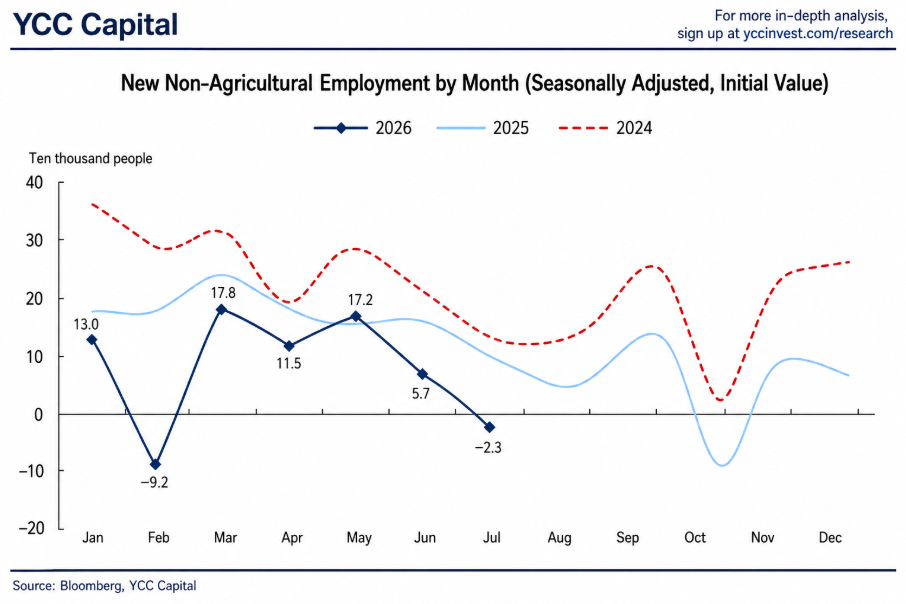
YCC CAPITAL U.S. Bond Strategy August 31, 2026 YCC Capital Perspective Federal Reserve Chairman Kevin Warsh used Jackson Hole to deliver a message that sounded sharper than the policy path it necessarily implies. His emphasis was unmistakably hawkish: inflation remains too high, the 2% target is not negotiable, financial conditions are not meaningfully restrictive, and the Federal Reserve should stop behaving as though markets deserve a running commentary on every future policy move. Yet the most important conclusion for investors is not that the Fed is preparing an aggressive tightening cycle. We believe Warsh is trying to rebuild monetary-policy credibility while preserving maximum flexibility. The tone is hard; the reaction function is more nuanced. That distinction matters. Markets heard the knife. We think policy may still prove softer than the rhetoric. Inflation Is Once Again the Center of Gravity Warsh placed inflation, rather than growth stabilization, at the center of the Fed’s mandate. Recent improvements in CPI and PCE inflation have not persuaded him that the underlying trend has decisively returned to target. A particularly important statistic was his observation that roughly 54% of items in the PCE basket are still rising at annual rates above 3%. In other words, inflation is not merely a story about a handful of volatile categories. Its breadth remains uncomfortable. Warsh also used unusually direct language in assigning responsibility for the inflation experience of the past several years to the central bank itself. His framing suggests that the Fed cannot afford another episode in which improving headline data leads policymakers to declare victory too early. For markets, the implication is straightforward: if underlying inflation does not move toward 2% clearly and fast enough, additional tightening remains available. That does not make a hike inevitable. It does mean the burden of proof has shifted. The Fed no longer needs to demonstrate why rates should stay high; incoming inflation data must demonstrate why they should come down. Anyone who has ever turned off a stove only to discover that the pan is still hot understands the problem. Monetary tightening may already have been applied, but residual heat can linger far longer than expected. Warsh appears determined not to mistake cooling for cold. Growth Is Not Weak Enough to Force the Fed’s Hand The second major message was confidence in the resilience of the U.S. economy. Warsh highlighted continued investment in artificial intelligence, healthy corporate profitability, solid private-sector demand, narrow credit spreads and active corporate financing. He also characterized the labor market as broadly consistent with full employment, while acknowledging pockets of structural pressure in housing and agriculture. This matters because Warsh does not appear inclined to use monetary easing as a pre-emptive support mechanism for growth. His preferred division of labor is increasingly clear. Productivity and private capital expenditure should generate economic growth. Markets should determine financial conditions. The Federal Reserve should focus primarily on price stability. YCC Capital views this framework as important for the medium-term U.S. rates outlook. The American economy still has meaningful sources of endogenous growth, particularly through technology investment and productivity improvement. That gives the Fed more room to tolerate restrictive rates than would be possible in an economy already slipping into broad contraction. We remain cautiously constructive on the United States for precisely this reason. High rates create real pressure, especially for housing, small businesses and interest-sensitive borrowers, but the economy is not behaving like a system that requires emergency monetary accommodation. The Fed Wants Out of the Hall of Mirrors Warsh devoted substantial attention to the dangers of habitual forward guidance. His concern is that the Federal Reserve signals its intentions, markets trade on those signals, and policymakers then interpret the resulting market prices as information about economic conditions. The process can become circular: the Fed watches markets that are themselves watching the Fed. It is a monetary-policy hall of mirrors. Warsh appears to want a quieter central bank—one that does not promise an interest-rate path, does not manufacture excessive certainty, and does not behave as though every market correction requires verbal reassurance. That approach would weaken the perceived “Fed put.” From an investment perspective, this may be one of the most consequential changes of the Warsh era. Less forward guidance means greater sensitivity to every inflation release, employment report and policymaker speech. The market will have to infer the reaction function repeatedly rather than simply follow a pre-announced path. That should produce more frequent repricing across Treasuries, the dollar and risk assets. The Market Heard a Hawk The immediate reaction was decisive. Following Warsh’s remarks, market pricing moved sharply toward a near-term rate increase. CME FedWatch implied a 57% probability of a 25-basis-point September hike, which would lift the policy rate to 3.75%–4.00%. The Treasury curve bear-flattened as front-end yields rose much faster than long-end yields. Between approximately 9:00 and 16:00, the 6-month, 1-year and 2-year Treasury yields increased by 7.1, 10.8 and 11.6 basis points, respectively. By comparison, 5-year, 10-year and 30-year yields rose 8.1, 4.4 and 1.3 basis points. The pattern makes sense. Short maturities are much more sensitive to the expected path of policy rates, while Warsh’s renewed commitment to the 2% inflation target helped anchor longer-term inflation expectations. The foreign-exchange and precious-metals markets told the same story. The U.S. Dollar Index rose from 99.17 at the start of the speech to 99.66 by 16:00, an increase of roughly 0.5%. London gold fell from approximately $4,615 per ounce to $4,456, a decline of about 3.4%. The dominant trade was a repricing toward higher real interest rates. U.S. equities initially responded positively to Warsh’s confidence in AI investment, corporate earnings and economic resilience. But as front-end Treasury yields continued climbing, discount-rate pressure ultimately overwhelmed the growth narrative and stocks retreated. Sources: Bloomberg, YCC Capital. Hard Words, Softer Hands We do not interpret Jackson Hole as a signal that a sequence of rate hikes is imminent. The deeper objective is credibility. Fiscal deficits, heavy long-duration Treasury issuance and a structurally higher term premium increasingly complicate monetary
America’s $40 Trillion Test Treasury Supply, Fiscal Gravity and the New Price of U.S. Credibility
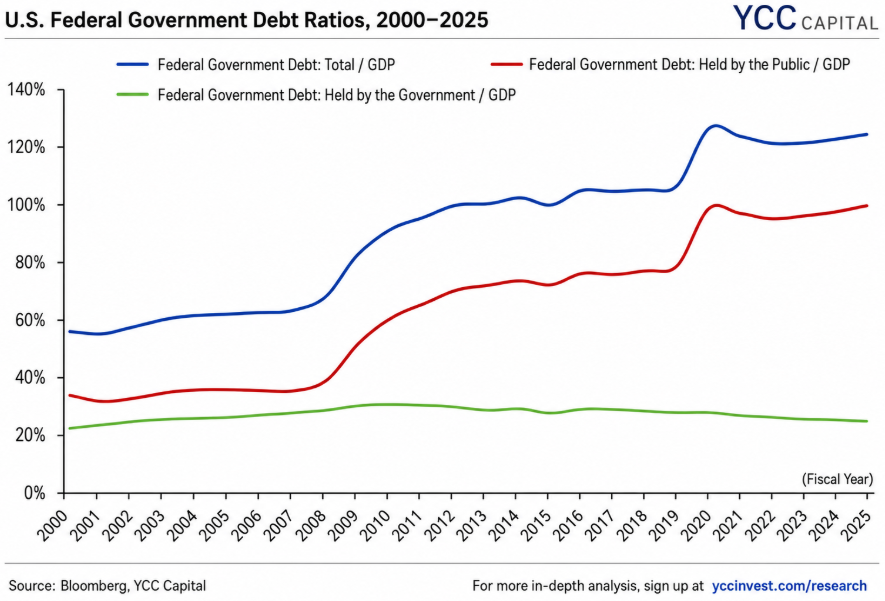
YCC CAPITAL U.S. Bond Strategy August 26, 2026 The U.S. fiscal debate has crossed an important threshold. The issue is no longer whether federal debt is “high” in an abstract sense; markets already know that. The more consequential question is how a nearly $40 trillion sovereign balance sheet behaves when refinancing costs remain elevated, political incentives discourage meaningful consolidation, and investors increasingly demand compensation for duration and policy uncertainty. Our view is deliberately more balanced than the most bearish fiscal narratives. America is not approaching an imminent sovereign funding crisis. The United States retains the world’s deepest capital markets, the dominant reserve currency, exceptional technological capacity and a tax base supported by a large, innovative private economy. Those advantages matter. Yet privilege is not the same as immunity. The cost of fiscal indiscipline is increasingly appearing where bond investors can see it most clearly: the term premium. The Fiscal Arithmetic Is Becoming Harder to Ignore Federal debt stood near $39.8 trillion at the end of July 2026, with roughly $32 trillion held by the public and the remainder largely represented by intragovernmental holdings. Publicly held debt is the economically important portion because it must ultimately be absorbed by households, institutions, banks, foreign reserve managers and the Federal Reserve. The trajectory is more significant than the headline number. Debt held by the public is around the size of annual U.S. GDP, and CBO projections point to continued increases over the coming decade. For fiscal 2026, CBO expects a deficit of roughly $1.9 trillion, or 5.8% of GDP, while debt held by the public reaches approximately 101% of GDP. Net interest costs alone are projected at roughly 3.3% of GDP. That last figure is the one investors should keep on the dashboard. For years, Washington could treat low interest rates as a kind of financial suspension system: debt rose, but servicing costs absorbed the bumps. That suspension is now stiffer. Federal net interest expense rose from about $352 billion in FY2021 to nearly $970 billion in FY2025, and the trillion-dollar annual interest bill has effectively arrived. For anyone who has refinanced a mortgage after years of unusually cheap money, the mechanism is familiar. The house has not changed, but the monthly payment has. Washington faces the same mathematics on a vastly larger scale. Refinancing Risk Matters More Than the Debt Headline The maturity structure of Treasury borrowing amplifies the sensitivity of the fiscal position to prevailing rates. At the end of June 2026, roughly $10.3 trillion of marketable interest-bearing Treasury debt was scheduled to mature within twelve months, approximately one-third of the outstanding stock. Securities maturing within five years represented more than two-thirds of the total. Treasury bills have also become an increasingly important funding tool. Between early 2023 and mid-2026, bills accounted for roughly 84% of newly issued marketable Treasury securities by gross issuance, versus approximately 76% during 2018–2022. There is sound logic behind this approach. Bills generally reduce near-term borrowing costs, satisfy enormous institutional demand for liquid collateral and support the plumbing of the dollar funding system. But short-term financing creates a treadmill: Treasury must keep returning to market. The result is not conventional default risk. It is repricing risk. Every large refinancing wave converts yesterday’s interest-rate environment into today’s budget expense. That helps explain why we expect the long end of the Treasury curve to remain structurally more volatile than investors became accustomed to during the post-global-financial-crisis era. Foreign Demand Remains Powerful—but It Is No Longer Infinite Foreign and international investors remain indispensable to the Treasury market. As of early 2026 they held approximately $9.5 trillion, or about 32.6% of marketable Treasury securities. Japan remained the largest individual foreign holder, followed by the United Kingdom and China. This is still a remarkable vote of confidence in U.S. capital markets. No competing sovereign bond market combines Treasury-like scale, liquidity, legal protections, collateral utility and convertibility. Yet the direction of travel deserves attention. Foreign ownership represented close to half of marketable Treasuries in the early 2010s. Today it is closer to one-third. The difference has increasingly been absorbed domestically. China deserves particular caution. Beijing has steadily reduced its Treasury exposure, but that shift should not automatically be interpreted as evidence that the renminbi is becoming a credible substitute for the dollar. China continues to face capital controls, policy opacity, weak domestic demand, property-sector stress and considerable uncertainty surrounding private-property rights and capital mobility. Those constraints substantially limit the international reserve role of RMB assets. Diversification away from the dollar can therefore occur without creating a true dollar replacement. Gold is the clearest beneficiary. The Political Ratchet Is the Core Fiscal Problem American debt accumulation is not explained by one administration or one party. The deeper problem is a bipartisan political ratchet. Republican governments generally find it politically easier to reduce taxes than to reduce popular entitlement programs or defense spending. Democratic governments generally find it easier to expand social programs and public investment than to raise sufficient revenue to pay for them. Over successive election cycles, the combination becomes simple: tax cuts stick, spending sticks, and the debt compounds. Mandatory spending illustrates why consolidation is so difficult. Social Security, Medicare, Medicaid and related programs now dominate the federal expenditure structure, supported by powerful demographic and political constituencies. Aging makes the arithmetic progressively less forgiving. This is why another round of discretionary spending restraint alone cannot solve the problem. A durable stabilization program would eventually require some combination of entitlement reform, broader revenue collection and faster nominal economic growth. The political system has shown little appetite for that bargain. Tariffs Are Not a Substitute for Fiscal Reform The Trump administration has attempted to combine domestic tax reductions, spending restraint and substantially higher tariffs. Tariffs can generate meaningful revenue, and CBO estimates that higher tariffs materially reduce projected cumulative deficits relative to a no-tariff baseline. But tariffs cannot carry the fiscal system on their own. Historically, customs duties represented only a small fraction of federal revenue in the modern income-tax era. Higher
The Long End Is Sending a Message: What Can Cool U.S. Treasury Yields?
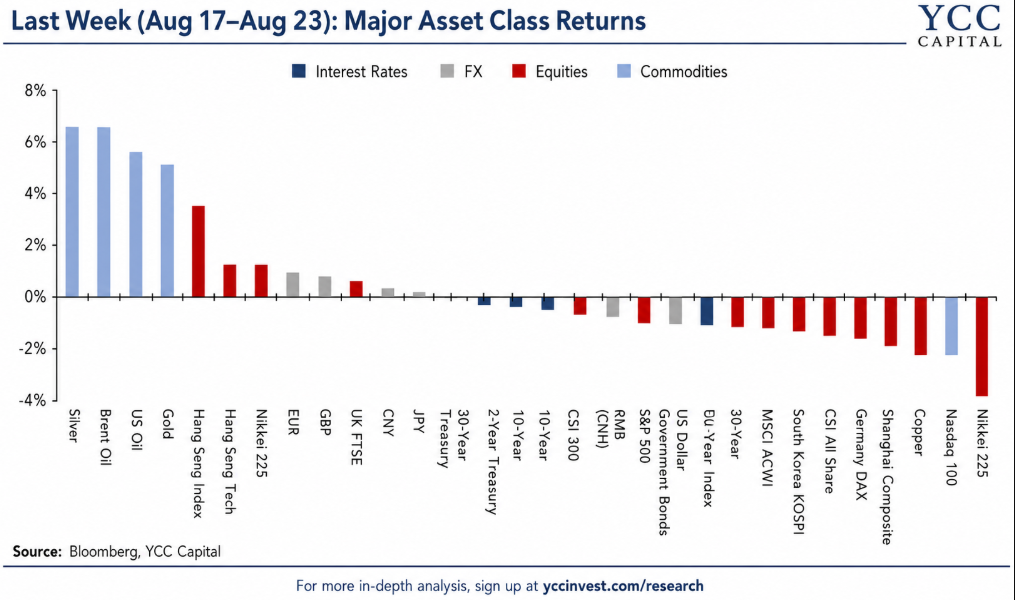
YCC CAPITAL U.S. Bond Strategy August 25, 2026 YCC Capital Research Long-duration U.S. Treasuries have become the pressure gauge for a market wrestling with fiscal supply, inflation uncertainty and increasingly complicated liquidity mechanics. The latest rise in yields is not simply another repricing of the Federal Reserve. It looks more like a chronic fiscal concern suddenly becoming acute. That distinction matters. A central bank can move overnight rates with one decision. It cannot erase a $40 trillion public-debt stock, change the maturity profile of Treasury issuance overnight, or instantly restore confidence in the long end. Yet we remain cautiously constructive on the United States. The Treasury market is under strain, not fundamentally broken, and policymakers still possess several tools capable of cooling yields—although nearly every tool comes with a cost somewhere else in the system. Market Pulse: The Long End Takes Control During August 17–23, long-dated Treasury yields drove global markets. The 10-year yield traded in a broad 4.63%–4.74% range, while the 30-year yield pushed above 5.33%, its highest level in roughly two decades. The dollar index fell below 98, its weakest level since May, while precious metals and crude oil outperformed and most major equity indices declined. Several forces converged. Oil remained elevated as negotiations around the Strait of Hormuz stalled and the U.S. position toward Iran hardened. At the same time, concerns intensified around large U.S. fiscal deficits, Japanese reductions in Treasury holdings and expanding bond issuance by major AI technology companies. Semiconductor stocks led the equity decline. Midweek brought temporary relief when the U.S. Treasury unexpectedly expanded its long-duration debt-buyback program. Yields dropped quickly and equities bounced, but the relief proved short-lived. Strong U.S. composite PMI data and better-than-expected jobless claims subsequently reinforced the economy’s resilience and pushed yields higher again. For investors, this is an important distinction: economic strength is still a positive feature of the U.S. story, but in the current bond-market regime, strong data can temporarily work against duration. Why Long-Term Yields Are Rising Since July, widening term spreads and rising term premium have been the dominant drivers of long-end yields. Earlier in the move, inflation uncertainty played a substantial role, particularly after questions emerged around the Federal Reserve’s inflation framework and oil prices lifted inflation expectations. More recently, however, liquidity and fiscal-risk premia have become more important. One pressure point is Japan. Treasury International Capital data showed Japanese Treasury holdings declining from roughly $1.24 trillion in February to $1.14 trillion in May and $1.12 trillion in June. Japan remains the largest foreign holder of Treasuries, so even a gradual reduction attracts attention. The market became especially sensitive following the July U.S.-Japan intervention in the yen. We do not view this as evidence of a structural Japanese retreat from U.S. assets. Japan’s portfolio decisions are being shaped by near-term currency-management and domestic-rate considerations. But when the largest foreign Treasury holder reduces exposure while Washington is issuing heavily, markets naturally demand a larger cushion. Fiscal arithmetic is the second pressure point. July’s U.S. federal deficit reached a record for the month, while public debt crossed $40 trillion, approaching the stated $41.1 trillion debt limit. Investors are therefore asking for greater compensation to hold duration. The third factor is corporate supply. Major U.S. technology companies have materially expanded issuance to finance AI investment. Apple, Amazon, Alphabet, Meta, Microsoft, Oracle and Nvidia are among the companies shaping this new supply environment. The peak issuance pace came earlier in the year, but the larger point remains: investors increasingly have attractive corporate alternatives competing with government bonds for balance-sheet capacity. In everyday terms, the Treasury market is no longer the only restaurant on a crowded street. When high-quality corporate borrowers open next door and offer an appealing spread, the government may have to offer a better price to fill every seat. Treasury Buybacks: Useful, but Not a Cure On August 19, the Treasury announced that buybacks of securities with maturities of 10 years and longer would be expanded by at least 100%, increasing the maximum size of an individual operation from $2 billion to $4 billion. Treasury Secretary Scott Bessent subsequently suggested individual operations could exceed $4 billion. The scheduled August–November buyback ceiling had originally been $63 billion. Seven long-end operations between September 10 and November 4 imply at least $14 billion of additional purchases, lifting the estimated total toward $77 billion. That sounds meaningful until it is compared with financing needs. Treasury estimates put third-quarter privately held net marketable borrowing near $739 billion. Buybacks therefore represent only about one-tenth of net issuance. The market understood the mathematics quickly. Long yields initially fell, but returned close to pre-announcement levels within days. Buybacks improve market functioning and can remove poorly traded securities, but they do not eliminate the underlying supply problem. The Bessent Option: Shorten the Government’s Funding Mix Treasury can further reassure markets by limiting increases in long-bond issuance and relying more heavily on bills. Mechanically, this reduces the amount of duration the private sector must absorb. But the strategy is not free. Bills already represent roughly 22% of marketable debt, around the level considered appropriate by the Treasury Borrowing Advisory Committee. A further shift toward short-term borrowing would make federal interest expense more sensitive to volatile short rates and require more frequent refinancing. It would also affect system liquidity. The Treasury General Account has effectively migrated from a roughly $600 billion center of gravity in the earlier period to around $1 trillion since 2024. Larger and more frequent bill issuance can pull cash toward the TGA, reducing bank reserves and Federal Reserve net liquidity. In other words, Treasury can shorten duration risk, but it may squeeze liquidity in the process. Push down one side of the mattress and another side rises. The Political Route: Fiscal Discipline Could Do More Than Buybacks The cleanest medium-term way to reduce Treasury term premium is tighter fiscal policy. The midterm elections could therefore become a major bond-market event. In our base case, a modest loss of House seats by Republicans could
Treasury’s Duration Pivot: What Bigger Buybacks Can—and Can’t—Do for the Long End
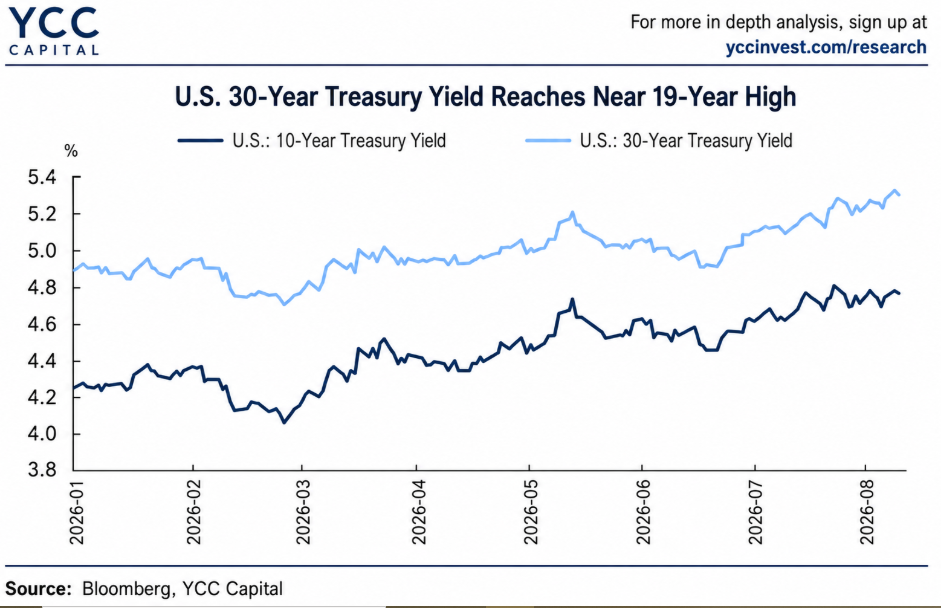
YCC CAPITAL U.S. Bond Strategy August 20, 2026 The U.S. Treasury has chosen an interesting moment to lean harder into long-duration bond buybacks. On August 19, Treasury announced that between September 9 and November 4 it intends to raise the maximum size of individual liquidity-support buybacks in the 10–20 year and 20–30 year maturity buckets from $2 billion to at least $4 billion. The timing matters. Long-end Treasury yields had already been sending a warning signal. The 30-year yield briefly reached 5.337% on August 18, the highest level since 2007, while the 10-year yield approached 4.739%. Against that backdrop, Treasury’s decision looks less like routine plumbing and more like a defensive adjustment to the market’s duration burden. Our central view is straightforward: the enlarged buyba ck program can improve market functioning and temporarily reduce pressure on the long end, but it does not alter the fundamental arithmetic of U.S. fiscal financing. In economic terms, Treasury is partly exchanging duration risk today for refinancing risk tomorrow. That can be useful, especially when long-end liquidity is strained, but it is not a substitute for stronger fiscal credibility, lower inflation risk, or deeper structural demand for long-dated government bonds. Why Treasury Is Acting Now Treasury officially describes the expansion as an effort to provide greater liquidity support in longer-dated nominal sectors where market participants have shown consistent interest. That explanation is accurate at the operational level, but it is incomplete from a macro perspective. When Treasury buys back older long-duration securities, it reduces the amount of duration the private sector must absorb at the margin. Unless the Treasury General Account alone finances those purchases, the cash ultimately has to be replenished through additional issuance elsewhere, most plausibly at shorter maturities. The economic effect therefore resembles a modest maturity transformation: retire some long-duration paper, replace part of the financing burden with shorter-duration debt. This is why we see the program as liquidity management with a duration-management consequence. The analogy is similar to refinancing a 30-year mortgage into a shorter reset structure. Your immediate fixed-rate burden can improve, but you have not made the underlying liability disappear. You have changed when and how the risk returns. That distinction matters because the U.S. debt stock is now approaching $40 trillion. Relative to that scale, even a meaningfully larger buyback program remains small. Still, financial markets often turn at the margin rather than at the average. When investors are reluctant to warehouse duration, a policy-linked buyer can have an outsized short-term psychological effect. That was visible immediately after the announcement. The 30-year Treasury yield fell by almost 9 basis points at one point, the 10-year yield declined roughly 3 basis points, while the 2-year yield rose approximately 5 basis points. The curve flattened sharply. Source: Bloomberg, YCC Capital The Arithmetic Is Still Small Assume, for illustration, that the maximum size for purchases in the two long-end maturity buckets rises from $2 billion to $4 billion over the coming quarter. Based on the historical cadence of these operations, the theoretical long-duration buyback capacity could increase from roughly $14–16 billion to about $28–32 billion. That sounds large in isolation. Against a Treasury market approaching $40 trillion, it is not. The first limitation is simply scale. Tens of billions of dollars cannot materially transform the aggregate supply dynamics of the world’s largest sovereign bond market. The second limitation is risk substitution. Private investors may hold somewhat less long-duration interest-rate risk, but Treasury must still finance deficits and refinance maturing obligations. Reducing duration outstanding today can increase the frequency with which debt must be rolled over in the future. Duration risk is therefore partly converted into rollover risk. The third limitation is the most important: long-term yields remain anchored by fundamentals. Fiscal deficits, inflation expectations, real interest rates, term premium and foreign demand for Treasuries will continue to determine where the 10-year and 30-year sectors clear over time. None of those fundamental forces has been transformed by the buyback announcement. U.S. inflation remains materially above the world investors became accustomed to in the pre-pandemic decade. Federal spending commitments remain sticky. Debt-service costs remain sensitive to refinancing rates, while the dollar-liquidity system continues to transmit U.S. financial conditions globally. For that reason, we would not characterize the buyback expansion as a lasting cure for elevated long-end yields. A Small “Treasury YCC” Effect—But Only at the Margin In the short run, however, the signal is tradable. When long-end yields are near multi-decade highs, liquidity discounts are widening and private balance sheets are becoming more reluctant to absorb duration, the appearance of a stable policy-related buyer can change market behavior even if the absolute purchase size is modest. In that narrow sense, the initiative resembles a miniature Treasury version of yield-curve management. We do not mean formal yield-curve control: there is no announced yield target, no commitment to unlimited purchases and no explicit mechanism linking Treasury actions to a particular level of long-term rates. But the market effect has a family resemblance. Treasury is responding to stress in the longer-dated market by increasing its willingness to absorb older long-duration securities. That can temporarily compress liquidity premiums, support dealer balance sheets and discourage one-way bearish positioning. The practical consequence is that investors should distinguish between the level of long yields and the path toward that level. Treasury may not be able to prevent fundamentals from pushing yields higher over time, but it can make the journey less disorderly. That matters for risk assets. A disorderly 30-year yield spike affects mortgage rates, corporate borrowing costs, equity discount rates and financial conditions far beyond the Treasury market itself. Slowing that transmission is valuable even if the underlying fiscal challenge remains. Fed and Treasury: Complementary Outcomes, Not a Coordinated Regime Recent Federal Reserve and Treasury actions can easily be interpreted as a coordinated package. The Fed has paused reserve-management purchases and is limiting liquidity injections, while Treasury is expanding long-end buybacks and adjusting the duration profile of debt held by the market. Superficially, it looks like one
The Dual Nature of Interest Rates: Why U.S. Treasury Yields Are Entering a Higher-for-Longer Regime
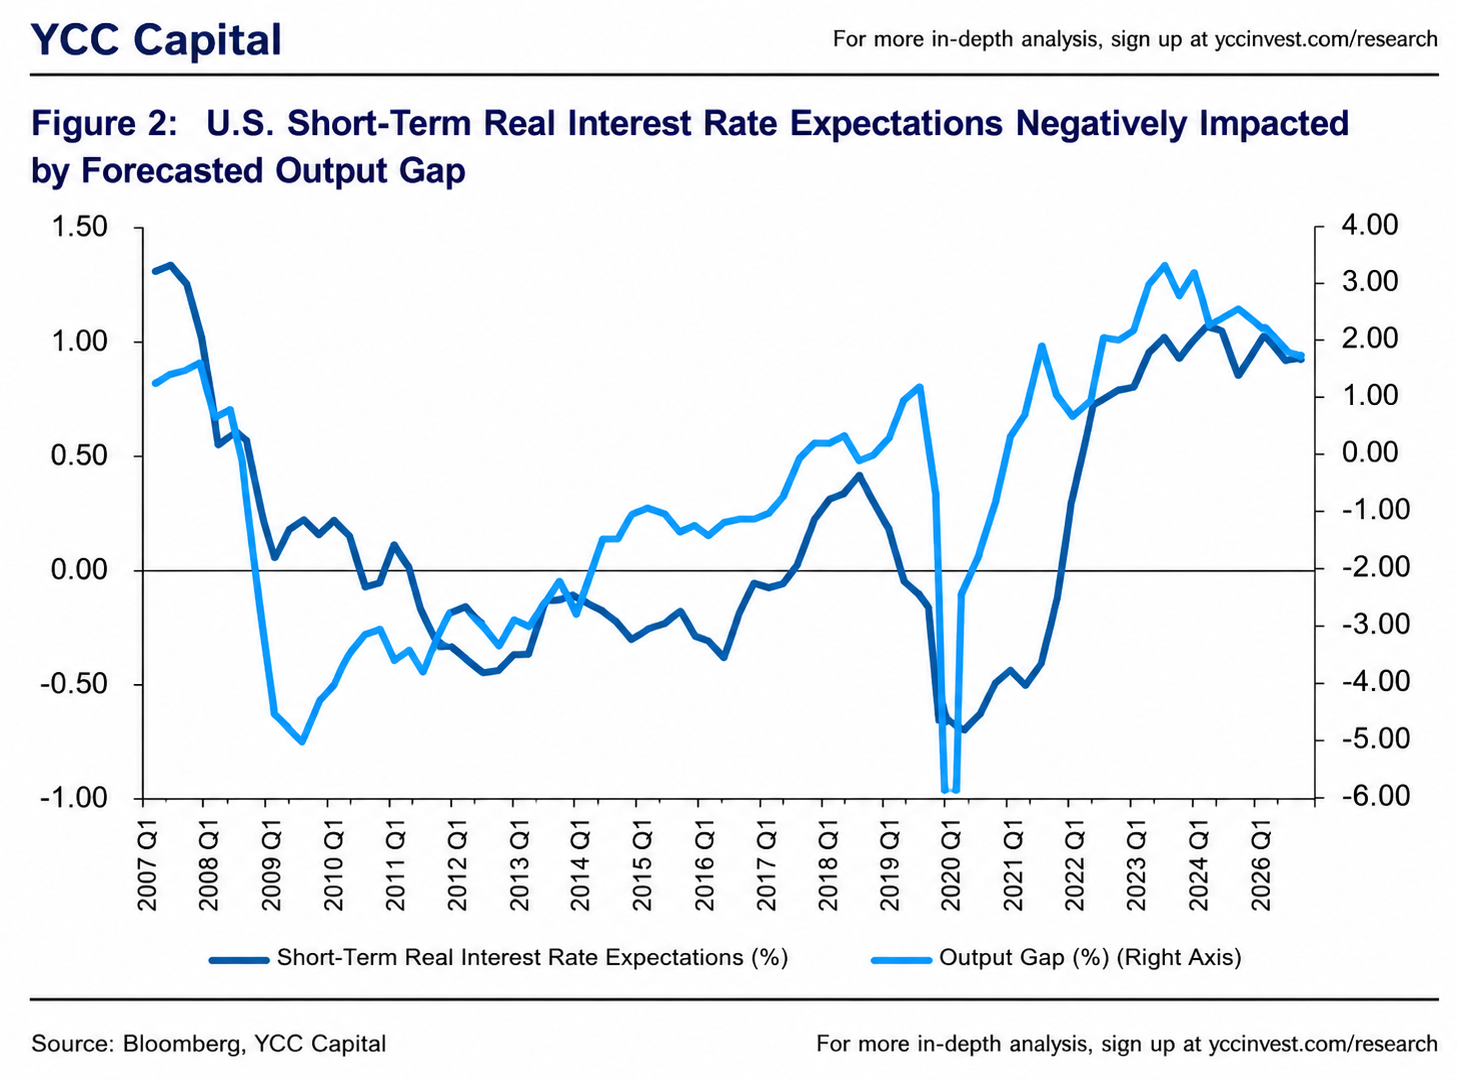
YCC CAPITAL U.S. Bond Strategy July 21, 2026 Executive Summary For decades, investors have searched for a single variable capable of explaining the direction of U.S. Treasury yields. Inflation expectations, Federal Reserve policy, fiscal deficits, demographic shifts, productivity growth, and global savings have each taken turns occupying center stage. Yet each framework eventually proves incomplete because interest rates themselves possess two distinct dimensions. They respond not only to the level of economic activity but also to the speed at which that activity is changing. This report introduces what we describe as the Duality of Interest Rates—a framework that distinguishes between the economy’s position within the business cycle and the economy’s underlying momentum. The interaction between these two forces explains why Treasury yields often behave in ways that appear contradictory under conventional models. At YCC Capital, we believe investors frequently make the mistake of comparing variables that belong to different economic dimensions. Economic growth is compared with unemployment, GDP with equity prices, or inflation with market returns, even though these variables evolve on different orders of change. Once this distinction is recognized, much of the apparent inconsistency in bond markets becomes considerably easier to understand. Our framework decomposes long-term Treasury yields into four underlying components: Expected future real short-term interest rates Inflation expectations Real term premium Inflation risk premium The first two are primarily determined by the output gap—the economy’s position relative to potential output—while the latter two are influenced simultaneously by both the output gap and changes in economic momentum. This distinction helps explain why long-term Treasury yields can continue rising even when inflation moderates or why yields sometimes decline despite surprisingly resilient economic data. Looking ahead, we believe the United States remains in an expansionary phase characterized by positive output gaps, resilient economic momentum, persistent fiscal support, and structurally higher capital investment driven by artificial intelligence. Under these conditions, short-term rates are likely to remain elevated while long-term yields continue to face upward pressure through higher term premiums. Our base case therefore remains one of higher-for-longer Treasury yields, accompanied by a steeper yield curve as markets gradually reprice structural inflation risks and fiscal sustainability. For investors, this environment requires a shift in mindset. The era when every growth slowdown automatically translated into collapsing bond yields is likely ending. Instead, long-duration government bonds increasingly resemble assets whose pricing depends as much on fiscal credibility and macro uncertainty as on monetary policy alone. YCC Perspective Anyone who has driven through mountain roads understands that two factors determine the journey. One is altitude. The other is the steepness of the road. A car climbing a gentle incline behaves very differently from one racing uphill even if both are technically at the same elevation. Financial markets work much the same way. The output gap represents the economy’s altitude—its structural position relative to potential output. Economic momentum measures how quickly conditions are changing. Markets respond to both simultaneously. Much of today’s confusion surrounding Treasury yields stems from focusing exclusively on one dimension while ignoring the other. Investors debate whether inflation is cooling or whether growth remains resilient, when the more important question is how both variables interact over time. This interaction lies at the heart of today’s bond market. Understanding the Dual Nature of Interest Rates The conventional approach assumes that long-term interest rates simply reflect inflation expectations and Federal Reserve policy. While intuitive, this explanation fails to capture why Treasury yields often move independently of near-term inflation data or policy expectations. Instead, we view long-term nominal Treasury yields as consisting of four distinct building blocks: Long-Term Treasury Yield = Expected Future Real Short-Term Rates Expected Inflation Real Term Premium Inflation Risk Premium Each component responds differently to changing macroeconomic conditions. Expected real policy rates largely depend on the business cycle. Inflation expectations also respond primarily to the output gap, although supply shocks can temporarily dominate cyclical forces. Term premiums, however, behave differently. Unlike policy expectations, term premiums compensate investors for uncertainty. They reflect changing perceptions regarding fiscal sustainability, liquidity conditions, monetary policy credibility, geopolitical risks, and future macroeconomic volatility. Consequently, term premiums fluctuate not only because the economy expands or contracts but also because investors become more or less uncertain about the future. This distinction is central to understanding why Treasury yields sometimes rise during periods when inflation itself appears to be easing. First-Order and Second-Order Economics The output gap and economic growth describe different dimensions of the economy. The output gap is fundamentally a level variable. It determines unemployment, inflation pressure, and monetary policy stance. Growth, by contrast, measures acceleration or deceleration. It explains corporate earnings growth, equity performance, credit expansion, and shifts in investor sentiment. Confusing these variables often produces misleading conclusions. For example, investors frequently compare GDP growth directly with unemployment. Yet unemployment responds primarily to the output gap rather than growth itself. Similarly, equity prices generally react not to GDP levels but to changes in growth momentum and earnings acceleration. Interest rates occupy a unique position because they respond to both dimensions simultaneously. They therefore possess what we call first-order and second-order characteristics. The first-order component reflects where the economy currently stands. The second-order component reflects where investors believe the economy is heading. Both matter. The Four Drivers of Treasury Yields Expected Real Short-Term Interest Rates The first component of Treasury yields reflects expected future Federal Reserve policy. In the long run, equilibrium real interest rates depend on demographics, productivity, labor-force growth, technological progress, and global savings behavior. Over shorter horizons, however, policy expectations dominate. Importantly, Federal Reserve decisions respond primarily to the output gap rather than quarterly fluctuations in GDP growth. During the early stages of recovery, growth may accelerate sharply while spare capacity remains abundant. Under such conditions, monetary policy generally remains accommodative. Conversely, late-cycle expansions often feature slowing GDP growth but persistently tight labor markets. Even though momentum weakens, positive output gaps require policy rates to remain restrictive. Understanding this distinction explains why slowing growth does not necessarily imply imminent rate cuts. Inflation Expectations Inflation
The Inflation Tide Is Finally Turning: Why June CPI May Mark the Beginning of the End for 2026 Fed Tightening Fears
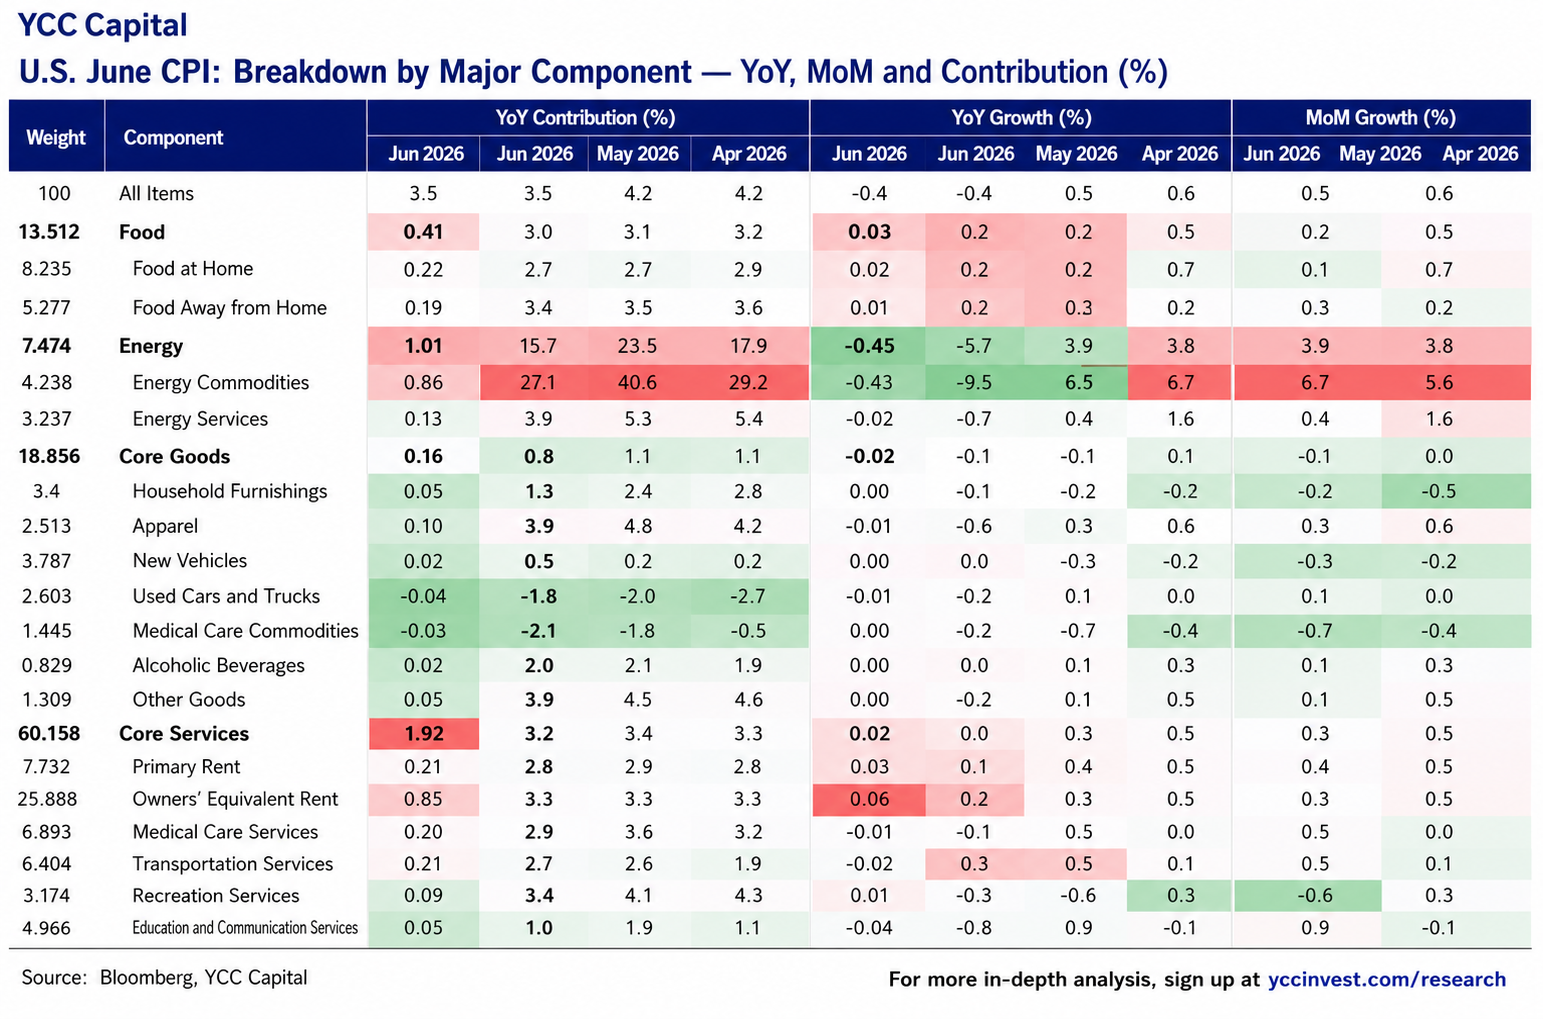
YCC CAPITAL U.S. Bond Strategy July 16, 2026 Executive Perspective Financial markets often resemble a crowded theater wh ere the greatest danger emerges not when the fire starts, but when everyone rushes toward the same exit simultaneously. Over the past month, investors collectively sprinted toward one conclusion: the Federal Reserve might be forced to resume tightening in 2026. Hawkish messaging following the June FOMC meeting, coupled with persistent geopolitical uncertainty and resilient economic growth, reignited concerns that inflation would once again escape policymakers’ control. June’s CPI report tells a different story. While inflation remains well above the Federal Reserve’s long-term objective, the latest data suggest that the underlying inflation engine is gradually losing momentum. Headline inflation surprised to the downside, core inflation softened more meaningfully than expected, and perhaps most importantly, the broad-based moderation across goods and services points to weakening domestic pricing pressure rather than a one-off statistical anomaly. For investors, this distinction matters enormously. Temporary disinflation driven solely by falling gasoline prices rarely changes monetary policy. Broad-based cooling across multiple inflation categories often does. Our base case therefore remains that the Federal Reserve is increasingly likely to remain on hold throughout 2026, with any further rate increases more likely postponed until 2027 should economic growth continue outperforming expectations. Markets may gradually begin unwinding the aggressive tightening expectations that developed after June’s FOMC meeting, allowing Treasury markets to stabi lize despite ongoing geopolitical volatility. Inflation Cools More Than Expected The June inflation report delivered a welcome surprise. Headline Consumer Price Index inflation slowed to 3.5% year-over-year, substantially below market expectations and down from 4.2% in May. On a monthly basis, CPI declined 0.4%, reversing the positive monthly increases recorded in previous months. Even more encouraging was the behavior of core inflation. Core CPI eased to 2.6% year-over-year, down from 2.9%, while monthly core inflation was essentially flat. This represents the first meaningful moderation in both headline and core inflation since March, suggesting that inflationary pressures are becoming increasingly less entrenched. Several factors contributed to the improvement. First, favorable base effects from mid-2025 mechanically reduced year-over-year inflation readings. While statistical effects alone should never be interpreted as genuine disinflation, they nevertheless create a more favorable backdrop over the coming months. Second, and more importantly, energy prices fell sharply throughout June. Gasoline prices declined by more than 10% during the month, exerting substantial downward pressure on headline inflation. Finally—and arguably most significant—the underlying momentum of core inflation weakened noticeably, indicating that domestic inflation pressures are gradually losing steam independent of energy markets. Inflation is no longer cooling solely because oil prices temporarily declined. It is cooling because pricing power across large portions of the U.S. economy is becoming increasingly constrained. That distinction fundamentally changes the monetary policy outlook. Energy Remains the Largest Swing Factor Energy provided the largest contribution to June’s disinflation. Energy inflation slowed to 15.7% year-over-year, nearly eight percentage points lower than May’s pace. Gasoline inflation decelerated particularly sharply, while fuel oil prices also moderated significantly. Retail gasoline prices fell from approximately $4.14 per gallon at the beginning of June to roughly $3.70 by month-end, creating an unusually powerful drag on monthly CPI. Food inflation, meanwhile, continued its gradual moderation. Overall food prices increased 3.0% year-over-year, only slightly below May’s reading, while grocery inflation remained relatively stable. Looking ahead, however, this favorable energy story may not persist indefinitely. Geopolitical developments surrounding Iran and the Strait of Hormuz continue introducing considerable upside risks to global oil markets. Renewed military confrontations have already disrupted shipping activity through one of the world’s most strategically important energy corridors. Even if outright military escalation is avoided, elevated geopolitical risk premiums are likely to keep crude oil prices trading near higher equilibrium levels than markets anticipated only weeks ago. Agricultural commodities also deserve attention. USDA projections continue pointing toward tighter grain markets due to stronger global demand alongside softer production for several major crops. Consequently, food and energy are likely to become sources of inflation resilience rather than outright disinflation over coming quarters. Core Inflation Is Quietly Improving If headline inflation attracted most of the media attention, core inflation deserves far greater attention from policymakers. Core goods inflation softened meaningfully across several major categories. Used vehicle prices resumed declining despite temporary fluctuations in wholesale auction prices. New vehicle prices remained broadly stable as easing supply chain pressures limited manufacturers’ pricing power. Medical goods inflation also weakened, while household furnishings and apparel showed slower price increases than earlier in the year. Perhaps even more encouraging was the moderation in core services. Core services inflation eased to approximately 3.2%, with housing inflation continuing its slow but persistent descent. Shelter remains the single largest contributor to overall inflation, yet rental indicators suggest further moderation is likely during the second half of the year. Forward-looking private-sector measures such as Zillow rental indices continue pointing toward softer rent growth, implying additional downside pressure on official shelter inflation over coming months. Transportation services, medical services, recreation, and communications all contributed to broader cooling across the services sector. Taken together, June’s report demonstrates that inflation moderation is becoming increasingly broad-based rather than narrowly concentrated. This is precisely the pattern Federal Reserve officials have been waiting to observe. The Super Core Measure Sends an Even Stronger Signal Federal Reserve officials increasingly emphasize “super core” inflation—core services excluding housing—as one of the best gauges of domestically generated inflation pressure. June’s data showed particularly encouraging progress. Super core inflation slowed to approximately 3.17% year-over-year, while monthly increases turned negative. Unlike gasoline prices, which can fluctuate dramatically because of geopolitical events, super core inflation largely reflects domestic labor costs, service-sector demand, and wage-driven pricing behavior. Its moderation therefore carries considerably greater policy significance. The weakening of super core inflation suggests that demand across the U.S. economy is gradually becoming more balanced without requiring a significant deterioration in employment conditions. This represents something policymakers have been attempting to engineer for several years—a gradual cooling of inflation without triggering recession. While success is far from guaranteed, June’s
The Fed’s New Sheriff: Warsh’s Debut Signals a Hawkish Reset and a Potential Overhaul of the Federal Reserve Framework
YCC CAPITAL U.S. Bond Strategy June 22, 2026 YCC Perspective Central banking is often compared to steering a large ship: course corrections usually come slowly, and the vessel rarely turns abruptly. The June FOMC meeting suggests the Federal Reserve may be preparing for something different. While markets focused on the decision to leave rates unchanged, the more important development was the shift in communication strategy under newly appointed Fed Chair Kevin Warsh. The message was clear: inflation control has re-emerged as the dominant priority, and investors may need to rethink assumptions that the next move is inevitably lower rates. This analysis is based on the June Federal Reserve meeting review contained in the source report. Executive Summary The June 2026 FOMC meeting marked a significant turning point in Federal Reserve communication and policy signaling. While the federal funds rate was left unchanged at 3.50%-3.75%, the meeting delivered a distinctly hawkish message. Key developments included: Removal of virtually all language implying future rate cuts. Stronger characterization of labor-market conditions. Unanimous support among voting members. Hawkish revisions in the dot plot. Upward revisions to inflation forecasts. Creation of multiple Fed working groups that may reshape communication and operational frameworks. The meeting represented Chair Kevin Warsh’s first FOMC gathering and may prove more consequential for future policy expectations than the rate decision itself. The June FOMC Meeting: What Changed? Policy Rate Left Unchanged On June 17, the Federal Reserve maintained the federal funds target range at 3.50%-3.75%. Following three consecutive rate cuts into the end of 2025, the Fed has now left rates unchanged at all four policy meetings in 2026. The decision was fully anticipated by markets, with CME futures pricing nearly a 99% probability of no change prior to the announcement. The End of the “Automatic Rate-Cut” Narrative The most notable change was not the rate decision itself, but the language surrounding it. The April statement had included wording that suggested policymakers were considering the timing and magnitude of further adjustments to rates. Markets interpreted this as meaning the next move would likely be a cut, with uncertainty centered only on timing. That language was completely removed in June. This deletion effectively eliminated the Fed’s prior easing bias and represented a meaningful hawkish recalibration. Labor Market Language Became More Optimistic The Fed upgraded its assessment of employment conditions. Previous references to subdued employment growth were replaced with language emphasizing that employment growth remains broadly consistent with labor-force expansion. Additionally, policymakers highlighted: Strong productivity growth. Robust capital investment activity. Continued labor-market resilience. These changes reinforce the Fed’s view that the economy remains capable of tolerating restrictive monetary policy. Unanimous Voting Outcome The April meeting had produced visible internal disagreement. Several officials opposed the easing bias embedded in the statement, while others advocated immediate rate cuts. By contrast, the June meeting resulted in a unanimous 12-0 vote. The shift suggests that internal consensus has strengthened around maintaining a restrictive stance and prioritizing inflation risks. Chair Warsh’s First FOMC: A New Operating Philosophy? Kevin Warsh’s first meeting as Fed Chair delivered a notable stylistic and strategic shift. The statement itself was substantially shortened and revised. According to Fed watchers, the communication framework was rewritten from beginning to end. Perhaps most importantly, the revised statement placed overwhelming emphasis on inflation while providing relatively limited discussion of employment concerns. The Fed continued to acknowledge: Elevated inflation. Significant uncertainty stemming from Middle East geopolitical tensions. Ongoing risks to the economic outlook. However, the balance of communication clearly shifted toward inflation control. The Dot Plot Turned Decisively Hawkish The June Summary of Economic Projections revealed a considerably more hawkish outlook than markets had anticipated. According to the projections: Roughly half of Fed officials now expect at least one rate increase during 2026. Nine officials projected at least one hike. Six projected two or more hikes. Only one participant forecast a rate cut. At the previous projection round, no officials anticipated rate increases. This represents one of the sharpest hawkish shifts in Fed projections in recent years. Could the Dot Plot Itself Disappear? An intriguing development was that Chair Warsh did not submit an individual interest-rate projection. This omission has sparked speculation that the new Chair may eventually modify or even eliminate the dot plot framework altogether. If that occurs, markets would lose one of their primary tools for interpreting future Fed intentions, potentially increasing volatility around policy expectations. Economic Forecasts: Slower Growth, Higher Inflation The Fed’s updated projections reflected a classic stagflationary tilt. Officials now expect: Growth Lower GDP growth in 2026. Lower GDP growth in subsequent years. Inflation Higher PCE inflation forecasts. Higher core PCE inflation forecasts. Further upward revisions extending into later years. The largest revision was to 2026 PCE inflation, which increased by approximately 90 basis points to 3.6%. Core PCE inflation is projected at approximately 3.3%. The message is straightforward: inflation is proving more persistent than policymakers expected earlier in the year. A Quiet but Important Development: Fed Working Groups Beyond rates and forecasts, another major announcement received relatively little market attention. The Federal Reserve plans to establish several specialized working groups covering: Communication practices. Economic data usage. Inflation analysis. Productivity trends. Artificial intelligence and its economic implications. These initiatives suggest Warsh intends to conduct a broad review of how the Fed communicates and operates. For investors, the implications may extend well beyond a single policy meeting. The way markets interpret forward guidance itself could change. Market Reaction: Hawkish Shockwaves Financial markets responded immediately. Equities Following the statement: S&P 500 declined sharply. Nasdaq fell nearly 1% initially before extending losses. Dow Jones Industrial Average weakened materially. Losses deepened further during Chair Warsh’s press conference. Treasury Market Two-year Treasury yields rose dramatically. The yield moved from below 4.06% before the decision to nearly 4.20% after the press conference. The move reflected aggressive repricing of future Fed policy expectations. U.S. Dollar The dollar index surged above the psychologically important 100 level and continued strengthening throughout the session. Gold Gold suffered one of the most immediate