
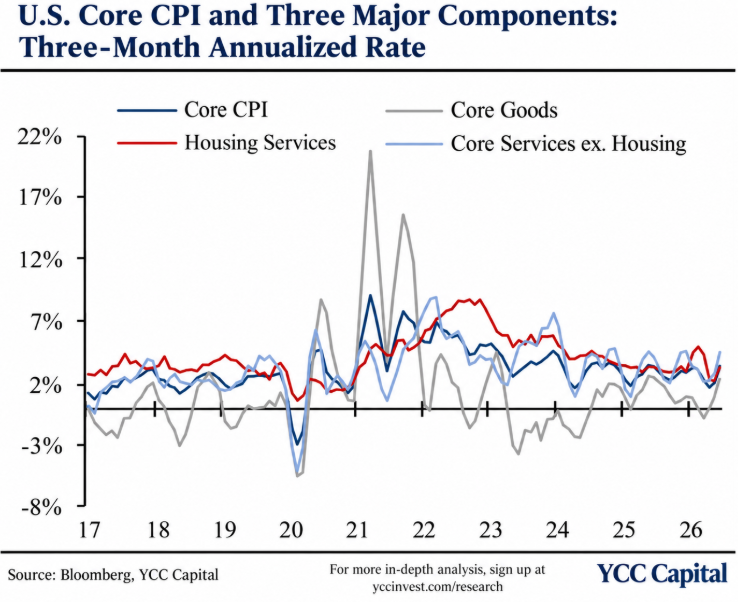
YCC CAPITAL U.S. Themes & Strategy October 16, 2026 YCC Capital Macro Research The YCC Perspective: Inflation Is Spreading, Not Retreating The September U.S. inflation figures deliver an uncomfortable message to investors: America’s economy remains resilient, but that resilience is becoming a double-edged sword for monetary policy. The inflation problem is no longer confined to a handful of volatile categories. Price pressures are spreading across goods, housing, transportation, and consumer services. At YCC Capital, we see the central risk as the persistence of elevated energy prices. Oil does not need to surge dramatically to disrupt the disinflation process. Simply remaining expensive for longer can steadily transmit inflation through transportation networks, production costs, and household budgets. Consider a family whose gasoline bill increases while hotel stays, clothing, and vehicle-related expenses also become more expensive. Even if individual price increases appear manageable, their combined effect gradually erodes purchasing power. This is precisely why the breadth of September’s inflation rebound matters more than any single headline number. Our central investment conclusion is straightforward: the U.S. economy remains fundamentally resilient, but the combination of persistent inflation, geopolitical uncertainty, and monetary-policy repricing argues for patience before materially increasing risk exposure. 1. September CPI: Inflation Exceeds Expectations Across the Board September headline CPI increased 0.65% month over month, exceeding the consensus forecast of 0.6% and accelerating from August’s 0.4%. Core CPI, excluding food and energy, rose 0.33% month over month, above the expected 0.2% and August’s 0.29%. On an annual basis, headline inflation reached 3.74%, compared with expectations of 3.6% and August’s 3.40%. Core inflation increased to 2.56%, exceeding the 2.5% consensus and the previous 2.45% reading. The distinction between headline and core inflation is important. Headline CPI was relatively close to expectations, while the more persistent underlying components delivered the principal upside surprise. Core inflation also accelerated despite an elevated comparison base in August, lifting its three-month average monthly increase. This makes it increasingly difficult to characterize September’s figures as a temporary statistical disturbance. Financial markets reacted immediately. Traders increased the implied probability of a Federal Reserve rate increase at the October 28 meeting from approximately 20% to more than 50% at its peak. Market pricing briefly approached 1.5 rate increases over the broader policy horizon. U.S. equities and gold declined, while Treasury yields and the dollar strengthened. Subsequent dovish comments from several Federal Reserve officials, emphasizing that an immediate rate increase was unnecessary, helped reduce the October hike probability toward 30% and brought Treasury yields lower. This sequence illustrates a defining characteristic of the current environment: markets remain highly sensitive to even modest changes in inflation expectations. 2. Core Goods: The Price Rebound Is Broadening Core goods inflation increased 0.25% month over month, compared with 0.11% in August, marking its strongest monthly advance since February 2025. Three forces appear particularly relevant: renewed global supply-chain pressures, tariff-related cost transmission, and price increases across selected technology and artificial-intelligence-related products. Used vehicles contributed approximately 9.6 basis points to monthly core-goods inflation, making them an important driver of the rebound. Notably, used-car CPI has recently diverged from the Manheim Used Vehicle Value Index, which historically provides a leading indication of retail vehicle-price developments by approximately two months. Such divergences complicate inflation forecasting. When established leading indicators lose explanatory power, investors must become more cautious about assuming that disinflation will automatically resume. Tariff-sensitive categories also strengthened. Recreational goods inflation accelerated from 0.02% to 0.31% month over month, while apparel inflation increased from zero to 0.86%. Toy prices were particularly notable, contributing approximately 6.6 basis points to monthly core CPI. These developments suggest that goods inflation is being supported by multiple overlapping pressures rather than a single isolated shock. 3. Housing Inflation: A Stubborn Obstacle Shelter inflation rebounded to 0.39% month over month, from 0.26% previously. Rent inflation increased to 0.25%, while owners’ equivalent rent rose to 0.35%. Hotel accommodation inflation remained elevated at 2.04%. Historically, home-price developments have led shelter CPI by approximately 16 months, while market-rent indicators have generally led official shelter inflation by six to eight months. Those relationships continue to suggest some potential for shelter disinflation. Nevertheless, September’s rebound demonstrates that the transmission from market rents to official inflation statistics is neither perfectly smooth nor guaranteed. Housing inflation also matters because shelter represents a substantial component of household spending. For a renter negotiating a lease renewal, inflation is not an abstract economic statistic. It is a monthly cash-flow constraint that influences discretionary spending, savings, and financial confidence. We therefore remain cautious about projecting a rapid normalization of shelter inflation, even where forward-looking indicators appear more favorable. 4. Supercore Inflation: The Warning Beneath the Surface Non-shelter core-services inflation moderated from 0.42% to 0.34% month over month, partly reflecting the disappearance of August’s temporary telecommunications-related disturbances. A broader supercore measure incorporating hotel accommodation similarly declined from 0.51% to 0.42%. At first glance, these declines appear encouraging. However, the underlying momentum tells a different story. The respective three-month annualized inflation rates reached approximately 4.43% and 4.48%. More importantly, price increases became increasingly widespread across transportation, recreation services, hotels, and other consumer-facing activities. Inflation breadth confirms this deterioration. The share of CPI categories recording annualized monthly increases above their five-year averages rose from 17.6% to 24.76%. Meanwhile, the share of categories experiencing annualized monthly inflation above 4% increased from 20% to 35%. This is one of September’s most consequential developments. A central bank can often look through isolated price shocks. Broad-based inflation, however, raises questions about the underlying balance between demand, supply, wages, and pricing power. 5. Oil Prices: The Higher-for-Longer Threat We identify two reinforcing conditions behind persistent inflation. The first is stronger-than-expected U.S. economic growth, which sustains consumer demand and allows businesses greater scope to pass through higher costs. The second is prolonged elevated oil prices, which amplify inflation transmission throughout the economy. Energy is embedded in far more than the price displayed at a gasoline station. It influences freight charges, aviation costs, manufacturing inputs, agricultural distribution, and the operating expenses of service businesses. An important implication
The Midterm Reckoning: How Washington’s Power Shift Could Reshape Markets, AI and America’s Fiscal Future
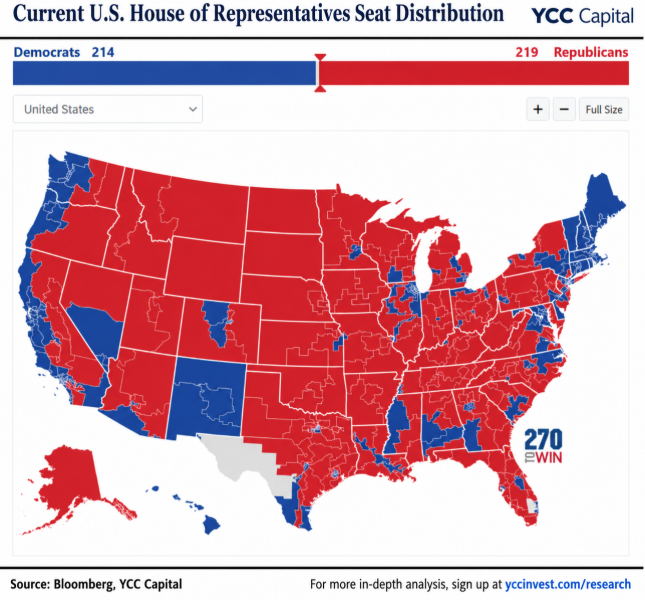
October 10, 2026 YCC CAPITAL | U.S. THEMES & STRATEGY Executive Perspective: The Election That Could Change the Rules The November 3 U.S. midterm elections are shaping up to be more than a referendum on President Donald Trump. They could determine the trajectory of American fiscal policy, the economics of artificial intelligence, and Washington’s willingness to sustain military commitments abroad. Our central investment thesis is that Republicans face a substantial risk of losing unified control of Congress, with the House of Representatives particularly vulnerable. Yet political gridlock should not automatically be interpreted as economic paralysis. A divided Washington can restrain fiscal excess, force greater scrutiny of spending, and create opportunities for investors who distinguish short-term political volatility from America’s enduring competitive strengths. The crucial question is not simply which party wins. It is how the resulting distribution of power changes the cost of capital, the direction of government spending, and the regulatory environment for America’s most important industries. 1. History Is Working Against the White House Midterm elections have historically been unforgiving to incumbent presidents. Across the 20 midterm elections between 1946 and 2022, the president’s party lost an average of 25.7 House seats and 3.3 Senate seats. Among 11 presidents who entered their first midterm elections with unified control of the White House and both congressional chambers, only four preserved that advantage. That represents a historical success rate of just 36.36%. Republicans entered the current election cycle with exceptionally narrow congressional margins. The October baseline showed Republicans holding 219 House seats against 214 Democrats, with two vacancies, while the Senate stood at 53 Republicans and 47 Democrats or aligned independents. Applying historical average losses mechanically would imply approximately 193 Republican House seats and a 50–50 Senate. History is not a forecasting machine, but it provides a powerful warning: narrow congressional majorities rarely survive a difficult political environment unscathed. 2. Inflation Is Becoming the Election’s Defining Issue As of October 5, Trump’s aggregate approval rating had declined to approximately 38.2%, its lowest level of his second term. The deeper problem is the perception of economic affordability. Survey findings indicate that 65% of Americans attribute elevated prices primarily to Trump’s policies, compared with 44% who attributed high prices to President Biden’s policies during the 2022 inflation episode. The distinction matters. Voters are not merely unhappy about inflation; they increasingly associate their financial pressure with decisions made in Washington. Consider an ordinary American family balancing mortgage payments, groceries, gasoline, and childcare. A higher oil price is not an abstract commodity-market development. It raises the cost of commuting, delivering food, booking flights, and ultimately maintaining a household budget. The continuing U.S.–Iran confrontation has intensified this pressure. Despite a preliminary understanding reached in late June, repeated cycles of escalation and de-escalation have prevented a durable normalization of energy prices. Polling suggests approximately 69% of respondents consider the conflict not worth fighting, compared with 64% in July, while only 28% approve of Trump’s handling of Iran. For markets, this creates an uncomfortable feedback loop: geopolitical uncertainty supports energy prices, higher energy prices undermine consumer confidence, and declining political support increases uncertainty around fiscal and foreign policy. 3. The House Looks Vulnerable; the Senate Remains Competitive House projections point toward a meaningful Democratic advantage. RealClearPolitics’ election assessment assigns 226 seats to Democrats and 185 to Republicans, with another 24 seats competitive or unresolved. Since 218 seats are required for a House majority, Democrats appear well positioned to gain control, although projections remain subject to polling error and late electoral shifts. The Senate is considerably less predictable. Only 35 of its 100 seats are being contested, limiting the extent to which national political sentiment can translate into a change in control. Competitive races in North Carolina, Ohio, Texas, Alaska, Iowa, and Maine could prove decisive. Democratic candidates have shown a particularly substantial polling advantage in North Carolina, around nine percentage points, while margins in several other competitive states are much narrower. Prediction-market pricing has placed the probability of Democratic Senate control near 65%, versus approximately 94% for Democratic House control. These are market-implied probabilities, not guaranteed outcomes. Our base case is therefore a Democratic House with Senate control less certain. The investment significance is straightforward: the loss of even one chamber would materially constrain the administration’s legislative flexibility. Election-night investors should also avoid confusing preliminary counts with certified outcomes. Mail ballots, provisional votes, overseas ballots, and recount procedures could extend uncertainty in closely contested races for one or two weeks. 4. Fiscal Policy: The Debt Ceiling Returns as a Political Weapon The more congressional seats Republicans lose, the greater the potential pressure for fiscal compromise. Historical comparisons suggest that larger declines in the governing party’s congressional advantage are associated with subsequent reductions in fiscal deficits and debt ratios. A regression covering 20 midterm elections produced a positive relationship between changes in governing-party seat advantage and subsequent deficit changes, with a slope of 5.1475 and an R-squared of 0.1425. The corresponding debt-ratio regression produced a slope of 9.4452 and an R-squared of 0.1065. These relatively low explanatory values are important. Congressional composition influences fiscal policy, but economic growth, interest rates, recessions, and extraordinary spending also matter. The more immediate catalyst is the federal debt ceiling. Legislation enacted in 2025 raised the statutory ceiling to approximately $41.1 trillion. Federal debt was projected to approach $39.6 trillion by the end of 2026, potentially bringing the government back into contact with the ceiling during 2027. Under divided government, raising that ceiling could require negotiations over spending restraint, revenue measures, or both. The precedent is 2011, when the Budget Control Act permitted approximately $2.1 trillion to $2.4 trillion in additional borrowing capacity in exchange for multiyear spending constraints and deficit-reduction mechanisms. Initial estimates envisioned at least $2.1 trillion in cumulative deficit reduction over a decade. A similar bargain in 2027 could produce modest fiscal consolidation. However, the underlying debt trajectory remains challenging. Long-term budget projections indicate that federal deficits could increase from 5.8% of GDP in 2026 to 6.7% by 2036,
America’s Expensive Rebuild AI, Strategic Manufacturing and the Price of Economic Transformation
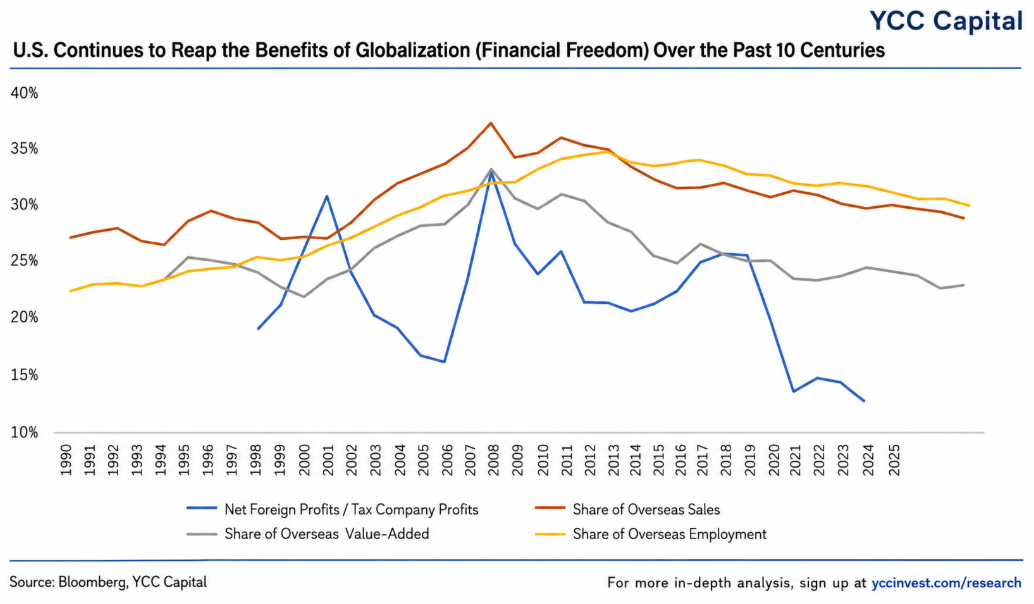
YCC CAPITAL U.S. Themes & Strategy August 27, 2026 America is not simply moving through another business cycle. It is attempting something harder: rebuilding strategic industrial capacity while carrying the fiscal legacy of the pandemic, structurally higher capital needs and an economy whose traditional sectors are increasingly uneven. At YCC Capital, we believe many features that appear contradictory—high long-term interest rates, soft hiring, resilient consumption, enormous AI investment and widening K-shaped outcomes—make more sense when viewed as the price of transformation rather than evidence that transformation has failed. The United States is effectively renovating the house while still living in it. Anyone who has gone through a major renovation understands the experience: the bill arrives before the new kitchen works, the hallway is covered in dust, and daily life becomes less comfortable long before the finished structure adds value. The economic equivalent is already visible. Capital is being redirected from short-cycle consumption toward long-duration investment, while interest rates, affordability and parts of the labor market absorb the disruption. Our central conclusion is cautiously constructive. The transition is expensive, politically difficult and increasingly unequal, but the United States has found a credible industrial anchor in AI. That substantially improves the odds that the current reindustrialization effort develops into something more durable than previous attempts. Source: Bloomberg, YCC Capital. The United States Is Rebuilding Strategic Capacity, Not Recreating the 1950s American concern over industrial decline is not new. Industrial-policy debates were already active in Washington in the early 1980s, and the modern reshoring cycle accelerated after the 2008 financial crisis. The Obama administration’s Advanced Manufacturing Partnership in 2011 captured the aspiration neatly: invent in America and manufacture in America. Yet aspiration was not enough. During the first decade of this century, U.S. corporations continued to benefit enormously from globalization, overseas profits and relatively low inflation. Cross-border financial integration remained extremely high, and there was little economic incentive to accept the near-term cost of rebuilding domestic capacity. The pandemic changed that calculation. Supply-chain disruption exposed the fragility of critical inputs, while emergency fiscal policy added roughly $4 trillion of cumulative deficit pressure relative to a pre-pandemic baseline, excluding associated interest expense. In effect, several years of fiscal capacity were consumed rapidly. The labor side has also shifted. By the second quarter of 2026, labor income represented about 52.4% of total income, roughly three percentage points below its 2010–2019 steady-state range and near the lowest level in the available data. At the same time, government transfers remain materially more important to household income than they were in earlier decades. This combination created urgency. The Infrastructure Investment and Jobs Act, CHIPS and Science Act and Inflation Reduction Act were all launched before ChatGPT became a mass-market phenomenon. Washington already understood that the next strategic frontier might involve semiconductors, clean energy, quantum computing, biotechnology or AI. What it lacked was a technology with sufficiently broad commercial potential, sufficiently large capital requirements and sufficiently strong U.S. comparative advantages to organize the investment cycle around. AI supplied that missing center of gravity. The key analytical mistake is to judge reindustrialization only by total factory employment. America is not attempting to reproduce twentieth-century mass-employment industrialization. It is rebuilding twenty-first-century strategic manufacturing capacity—fabs, data centers, advanced machinery, power infrastructure, software, high-end computing and critical supply chains. Employment data already show strength in the front end of this process: factory construction and related activity have expanded materially since 2010. Output data make the change still clearer. Investment is concentrated at both the front end, where facilities are being built, and the back end, where strategic manufacturing, batteries, vehicles, grid equipment and AI-related capacity are entering production. This also explains why old industrial indicators can mislead. A modern automated semiconductor facility or data center does not translate output into employment or electricity consumption in the same proportions as a twentieth-century factory. Much of the new capacity is still under construction, being installed or moving through ramp-up phases. Source: Bloomberg, YCC Capital. High Rates Are Part of the Bill The second major implication of this transition is that structurally higher long-term rates are not simply a Federal Reserve story. After depreciation, U.S. net national saving has moved close to zero. Persistent government dissaving absorbs much of the surplus generated by households and businesses just as private-sector demand for capital is accelerating across AI infrastructure, information equipment, manufacturing and utilities. That imbalance matters for Treasuries. With foreign official holdings no longer expanding rapidly enough to absorb incremental duration automatically, more long-dated government debt must clear through price-sensitive private investors. Unless either fiscal deficits or private investment adjusts sharply, equilibrium requires a higher real yield, a higher term premium, or both. The political hierarchy is becoming clearer. Washington is far more likely to tolerate elevated rates than deliberately choke off the AI investment cycle. Neither a sudden collapse in AI capital expenditure nor an immediate fiscal consolidation appears realistic. This is why we would be cautious about assuming that policy-rate cuts automatically restore the ultra-low long-end yields of the 2010s. AI also has a potentially important monetary dimension. The United States can export an integrated, dollar-denominated technology stack: advanced chips, cloud capacity, software licenses, data-center equipment, energy infrastructure and financing. Partner economies seeking access to this ecosystem may simultaneously accumulate dollar assets, invest directly in the United States and own U.S. technology equities. That creates what we would describe as a reinforcing combination of “technology-dollar” demand and “safe-asset-dollar” demand. De-dollarization remains a slow diversification process measured in years and decades, not an overnight replacement event. The constraint is straightforward: productivity must eventually justify the financing cost. If AI investment produces returns above the economy’s marginal cost of capital, the investment boom can improve fiscal and debt dynamics over time. If returns disappoint, the same spending could intensify the pressure. Main Street Is Paying Before the Productivity Dividend Arrives The most uncomfortable part of the transition is that traditional sectors are already carrying much of the cost. Thirty-year mortgage rates have returned to roughly 6.8%,
The Headline Slowed. America’s Economic Engine Did Not.
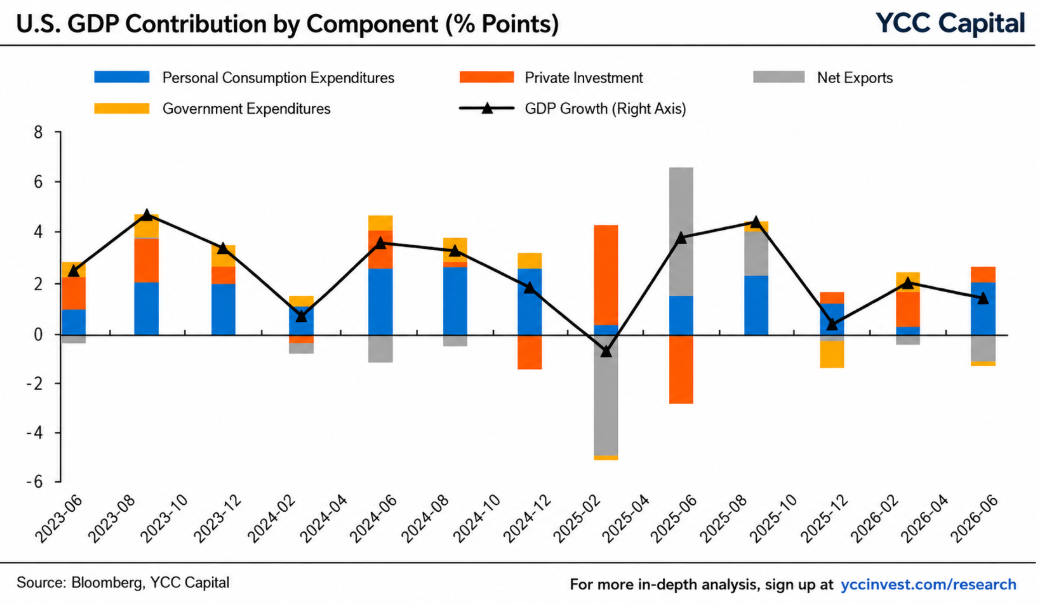
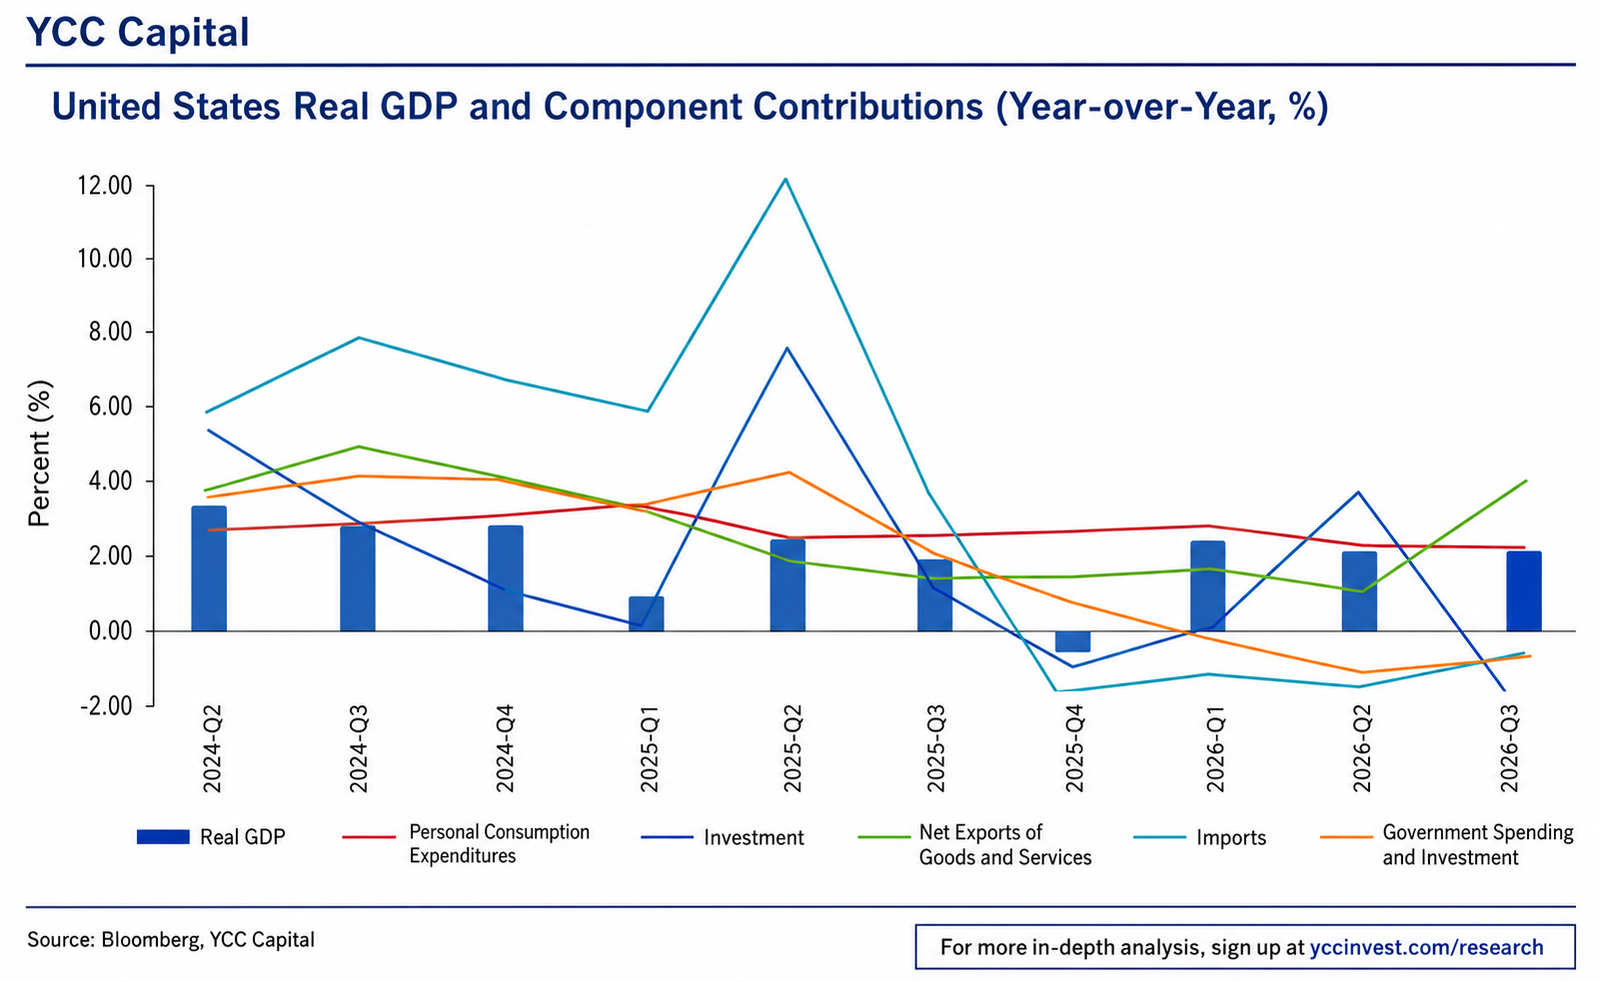
YCC CAPITAL U.S. THEMES & STRATEGY August 5, 2026 YCC Perspective The U.S. economy entered the second quarter looking weaker on the surface than it felt underneath. Real GDP expanded at a 1.5% annualized rate, down from 2.1% in the first quarter and below the 2.1% market consensus. Yet the headline was distorted by two of the most volatile components in the national accounts: inventories and net exports. Strip those away, and the picture changes materially. Real final sales to private domestic purchasers—the clearest measure of household spending and private fixed investment—accelerated from 1.7% to 3.9%. In other words, the economy’s paintwork looked scratched, but the engine was still running smoothly. YCC Capital’s conclusion is cautiously constructive. U.S. domestic demand remains resilient, consumer activity has reaccelerated, and artificial-intelligence-related capital expenditure continues to support business investment. The challenge is that this resilience is increasingly accompanied by renewed inflation pressure, leaving the Federal Reserve with less room to relax policy. Headline GDP Understates Domestic Strength Second-quarter real GDP growth slowed to 1.5% annualized from 2.1% in the first quarter and 3.8% a year earlier. The slowdown, however, did not reflect a broad collapse in final demand. Private inventory accumulation moved from contributing 0.23 percentage points to first-quarter growth to subtracting 0.67 percentage points in the second quarter. Net exports reduced growth by another 1.01 percentage points. Together, these volatile categories obscured a much firmer domestic economy. The domestic purchases price index rose at a 5.7% annualized pace, up sharply from 3.6% in the first quarter. Following the release, market pricing for a September rate increase rose from 55.4% to 61.4%. The message was uncomfortable but clear: growth was softer in the accounting sense, while underlying demand and inflation were stronger in the economic sense. This is the kind of GDP report that rewards looking beyond the first line. Much like a household budget temporarily distorted by a large tax payment or inventory purchase, quarterly GDP can tell a misleading story when transitory components dominate the calculation. Consumers Are Still Spending, but the Cushion Is Thinning Personal consumption expenditures rose 3.2% annualized, sharply higher than 0.5% in the first quarter and 2.5% a year earlier. Consumption contributed 2.12 percentage points to overall GDP growth, making it the quarter’s principal source of strength. Goods spending increased 5.2%, while services spending rose 2.2%. Durable-goods consumption advanced 6.8%, outpacing the 4.4% increase in nondurable goods. Motor vehicles and parts, furniture, household durables, prescription drugs, and other nondurable goods provided the strongest support. Gasoline and other energy products, together with housing and utilities, were among the few negative contributors. The composition is encouraging, but the financing of that consumption is less reassuring. Disposable-personal-income growth has generally slowed since 2023, while the personal saving rate has fallen to 2.7%, close to its 2022 low. For many households, this resembles the final stretch of a long road trip: the car is still moving at speed, but the fuel gauge deserves attention. Consumers retain momentum, yet they have less savings capacity to absorb future shocks. Continued spending growth will increasingly depend on income gains, credit availability, and labor-market stability rather than further reductions in savings. AI Capital Spending Is Broadening the Investment Cycle Gross private domestic investment increased 3.0% annualized, down from 7.9% in the first quarter. The apparent slowdown was overwhelmingly driven by inventory adjustment. Fixed investment rose 7.0%, accelerating from 6.5% in the first quarter and 4.4% a year earlier. Nonresidential investment remained the backbone of the expansion. Equipment investment surged 15.2%, while intellectual-property investment increased 8.8%. Demand for information-processing equipment continues to benefit from the buildout of AI infrastructure, advanced computing capacity, and data-center deployment. Importantly, the investment expansion was not confined to a narrow group of semiconductor and cloud-computing companies. Industrial equipment and transportation-equipment investment also strengthened, suggesting that the capital-spending cycle is beginning to reach beyond the most visible AI beneficiaries. Software and research-and-development spending remained robust, reinforcing the view that AI investment is not simply a hardware cycle. It is increasingly an organizational and intellectual-capital cycle as companies redesign workflows, automate tasks, and embed computing capacity throughout their operations. Structures investment remained weak because of elevated financing costs and soft demand in portions of commercial real estate. Residential investment rose 1.5%, ending five consecutive quarters of decline, but housing remains constrained. The average 30-year fixed mortgage rate rose to 6.41% from 6.11% in the first quarter. Lennar’s average home-delivery price fell to approximately $371,000, its lowest level since 2017, indicating that builders continue to use price concessions to offset affordability pressure. Trade Is a Drag, but Not for the Usual Reason Net exports subtracted 1.01 percentage points from GDP growth. Exports rose 4.5%, down from 10.9% in the first quarter, while imports increased 11.5%. Goods exports grew 8.9%, compared with 18.8% previously, and services exports contracted 3.3%. Travel and business services were notable areas of weakness. By contrast, goods imports rose 14.7%, driven by communications equipment, semiconductors, components, and industrial machinery. The trade deficit therefore reflects, in part, a strong domestic investment cycle rather than simply weak competitiveness. U.S. firms are importing the physical building blocks of the AI economy. High-technology industries obtain a substantial portion of their equipment from overseas, so continued AI infrastructure investment is likely to keep capital-goods imports elevated. This may weigh on reported GDP in the near term, but the economic interpretation is more nuanced. Imported equipment subtracts from current-quarter GDP accounting, while the productive capacity it creates may support future output and earnings. Fiscal Support Remains Larger Than the Quarterly Data Suggest Government consumption and investment declined 0.8% annualized after rising 4.4% in the first quarter, subtracting 0.14 percentage points from GDP growth. Federal spending fell 4.1%, led by a 12.9% decline in nondefense spending. The weakness largely reflected increased sales from the Strategic Petroleum Reserve. Under national-accounting rules, government receipts from sales of goods reduce measured government consumption expenditures. The transaction changes the composition of GDP but does not directly reduce total GDP because corresponding
America’s Consumer Credit Isn’t Breaking—It’s Splitting: Why Record Delinquency Rates Tell Only Half the Story
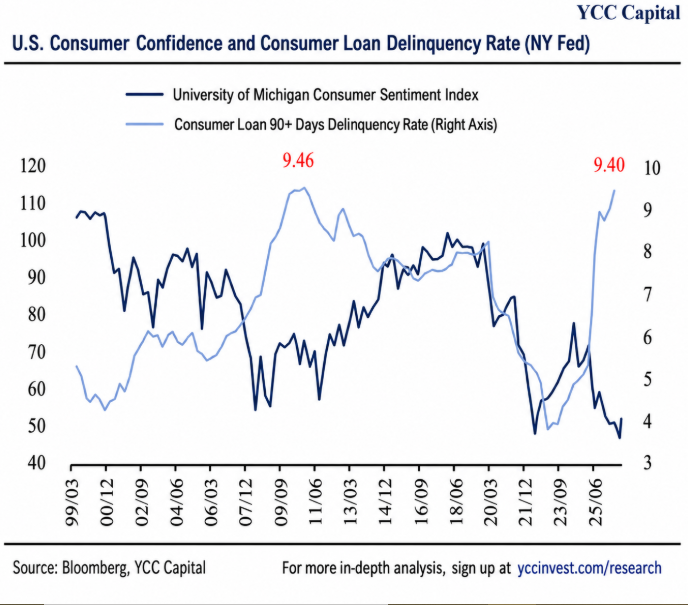
YCC CAPITAL U.S. Themes & Strategy August 3, 2026 YCC Perspective Every economic cycle has a statistic that dominates headlines. Today, it is America’s consumer credit delinquency rate. On the surface, the data appears alarming: auto loan delinquencies have reached their highest level since records began, while credit card delinquencies are hovering near post-Global Financial Crisis highs. At first glance, such figures seem to suggest that U.S. household balance sheets are deteriorating rapidly. Our analysis reaches a more nuanced conclusion. Much like a physician who distinguishes between a patient’s temperature and the underlying illness, investors should separate headline delinquency statistics from the actual trajectory of household financial health. Many of today’s elevated delinquency measures reflect statistical methodology, the normalization of extraordinary pandemic-era policies, and shifts in borrower credit composition rather than an economy-wide collapse in repayment capacity. This distinction matters enormously. While the U.S. consumer is undoubtedly becoming more polarized, the evidence does not support the view that America is entering a broad-based household credit crisis comparable to 2008. Instead, the stress remains concentrated among lower-income households and subprime borrowers, illustrating a K-shaped recovery that continues to define the post-pandemic economy. One useful analogy is traffic after a snowstorm. Even after the roads have been cleared, congestion remains because vehicles already caught in traffic continue moving slowly. Likewise, today’s stock of seriously delinquent loans reflects legacy stress accumulated over several years rather than an accelerating wave of new defaults. Executive Summary Since the pandemic, severe consumer credit delinquencies in the United States have climbed steadily. According to New York Federal Reserve data, serious delinquency rates (90+ days past due) for auto loans have reached record highs, while credit card delinquency rates have approached levels last seen following the Global Financial Crisis. However, headline figures overstate the degree of deterioration. YCC Capital finds that several technical factors—including statistical definitions, delayed recognition embedded in stock delinquency measures, and pandemic-driven credit rating migration—have materially exaggerated the apparent worsening in household credit conditions. When examining more forward-looking indicators such as new delinquency formation, the data suggest that consumer credit stress has largely stabilized rather than continuing to deteriorate. Nevertheless, structural vulnerabilities remain significant. Credit stress is increasingly concentrated among lower-income households, subprime borrowers, and consumers with limited remaining credit availability. Until employment growth and real income continue broadening across income groups, this lower tier of the American consumer will remain one of the economy’s principal macro vulnerabilities. America’s Household Credit Landscape Household debt in the United States remains overwhelmingly dominated by residential mortgages. As of the first quarter of 2026, total household debt stood at approximately $18.8 trillion, with mortgages representing roughly 70% of total liabilities. Consumer credit constitutes the remaining share, led primarily by: Auto loans (approximately 9%) Student loans (8.8%) Credit cards (6.7%) This composition explains why headline household balance sheets continue to appear relatively resilient despite rising consumer credit stress. Unlike previous tightening cycles, most American homeowners refinanced during the extraordinarily low interest-rate environment of 2020-2021. Millions effectively locked in mortgage rates below current market levels for decades, insulating housing-related debt service from the Federal Reserve’s subsequent tightening campaign. As a result, mortgage delinquencies remain historically low. Consumer credit tells a very different story. Auto loans, credit cards and student loans have all experienced significant increases in serious delinquency rates over the past three years, creating an increasingly visible bifurcation within household balance sheets. Rather than representing a nationwide deterioration, these figures demonstrate the growing divergence between households benefiting from appreciating assets and locked-in financing costs versus those relying heavily upon short-duration consumer borrowing. Why Headline Delinquency Rates Overstate the Problem The most widely cited measure comes from the New York Federal Reserve’s Household Debt and Credit Report, which tracks loans more than 90 days delinquent. While useful, this metric contains important limitations. Unlike commercial bank delinquency statistics, the New York Fed continues counting loans that have already entered severe distress—including charged-off loans and loans in foreclosure—until lenders cease reporting them. Consequently, the measure behaves like a stock variable, accumulating past problems long after new deterioration has slowed. Imagine measuring rainfall by the water already collected inside a reservoir rather than the rain currently falling. Even after the storm ends, the reservoir remains full. This is precisely what has occurred in consumer credit. When examining new delinquency formation—both 30-day and 90-day transitions—the deterioration appears to have peaked before beginning a gradual moderation. Newly emerging repayment problems have eased even while legacy delinquent balances continue inflating headline statistics. Commercial bank data tell a similar story. Bank credit card delinquency rates have already begun gradually declining from recent highs, while charge-off rates have also started retreating. The divergence between banking data and New York Fed statistics largely reflects methodological differences, along with broader coverage of non-bank lenders such as auto finance companies and specialized consumer finance institutions, where credit quality is generally weaker. For investors, this distinction is critical. Stock delinquency rates describe the legacy of previous stress; flow measures provide a clearer picture of current credit conditions. The Hidden Legacy of Pandemic Credit Inflation An overlooked driver behind today’s elevated delinquency rates is the extraordinary improvement in consumer credit scores during the pandemic. Fiscal transfers, payment moratoriums, aggressive monetary easing and household deleveraging temporarily strengthened borrower balance sheets. Many consumers—particularly those previously categorized as subprime—experienced substantial improvements in measured credit scores. On paper, this appeared highly encouraging. In practice, it also produced unintended consequences. As credit scores improved, banks and non-bank lenders expanded credit availability through larger credit limits and easier underwriting standards. Yet improvements in reported credit quality often exceeded improvements in borrowers’ long-term repayment capacity. The result was effectively an inflation of credit ratings. Once pandemic support faded and interest rates rose sharply, these expanded credit lines increasingly migrated into delinquency, particularly among lower-quality borrowers whose underlying income growth had not kept pace with rising borrowing costs. Fortunately, this distortion has been gradually unwinding since lending standards tightened beginning in 2022. More recent loan vintages already demonstrate improving repayment
The Three Forces Behind AI’s Valuation Reset: Geopolitics, Monetary Policy, and the New Economics of AI
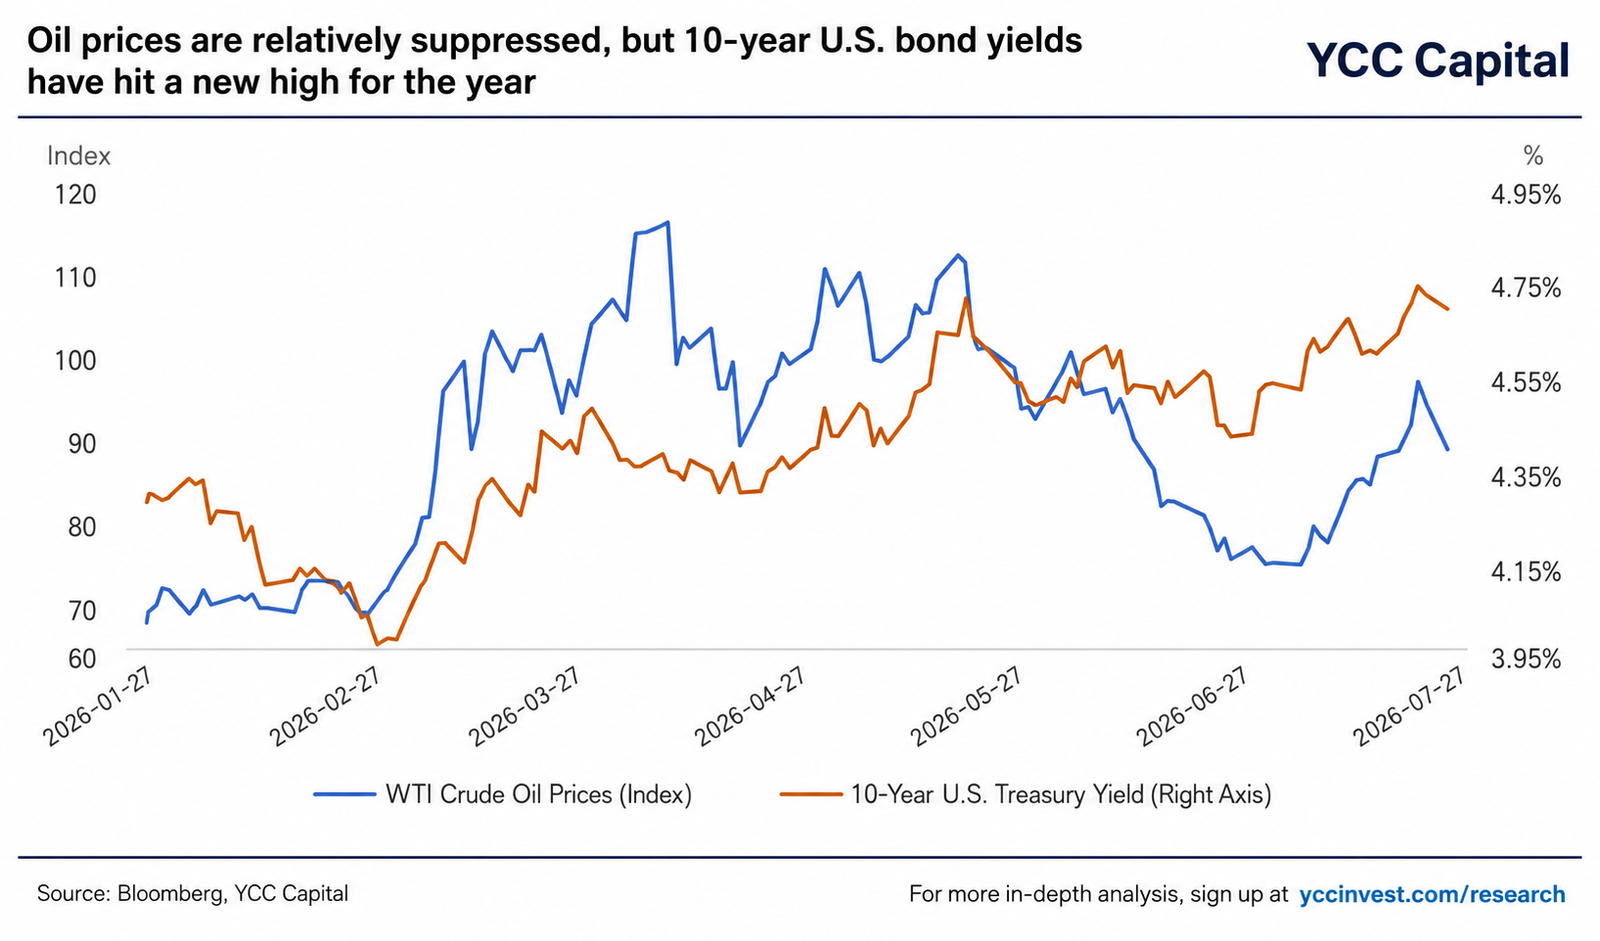
YCC CAPITAL U.S. Themes & Strategy July 29, 2026 Executive Summary Markets rarely move for a single reason. Just as a pilot constantly adjusts for wind, altitude, and engine performance simultaneously, investors must recognize that today’s AI correction is not simply a technology story. It is the intersection of geopolitics, macroeconomics, and the evolution of the AI business model. At YCC Capital, we believe recent weakness across AI-related equities reflects a transition from an investment environment that rewarded aggressive capital deployment toward one demanding tangible economic returns. While geopolitical tensions in the Middle East have injected fresh volatility into energy markets, and higher interest rates have increased the cost of capital, neither development fundamentally invalidates the long-term AI investment thesis. Rather, they raise the standard of proof. The coming quarters are likely to be defined less by headline excitement surrounding larger models and more by measurable evidence that AI applications can generate sustainable revenue, justify unprecedented capital expenditures, and ultimately create durable shareholder value. Three Drivers Are Now Steering AI Valuations The recent repricing of AI assets has emerged from three interconnected developments: First, geopolitical risks surrounding the United States and Iran continue to create uncertainty in energy markets. Second, monetary policy remains restrictive as the Federal Reserve keeps financial conditions tight. Third, AI itself is entering an entirely different investment phase where profitability matters as much as innovation. Individually, each force would likely have been manageable. Together, they have forced investors to reassess valuation multiples across the technology sector. Geopolitics: Markets Continue to Expect Escalation Followed by De-escalation The confrontation between Washington and Tehran remains capable of producing repeated episodes of market volatility. However, both sides also possess strong incentives to avoid a prolonged military conflict. Iran views control over the Strait of Hormuz as one of its most important geopolitical and economic bargaining chips. For the United States, maintaining stability in this region remains essential for preserving broader strategic influence. Yet financial markets ultimately impose their own discipline. Higher oil prices, rising Treasury yields, and equity market weakness all increase the political costs associated with sustained military escalation. This creates what markets increasingly recognize as the “TACO” dynamic—Trump Always Chickens Out—where aggressive rhetoric is ultimately followed by compromise once financial conditions deteriorate sufficiently. According to the source report, market participants have become noticeably more experienced in pricing geopolitical shocks. During the initial conflict earlier in the year, investors immediately rushed toward worst-case scenarios. The latest flare-up generated a far more measured response, with significant concern emerging only after crude oil approached the psychologically important $100 per barrel threshold and technology shares simultaneously entered a correction. This evolution reflects an important behavioral shift. Markets learn. Investors who once feared every headline now demand confirmation before repricing risk. Our base case therefore remains that geopolitical tensions will continue producing periodic volatility rather than a sustained global energy crisis. The Federal Reserve: Holding Rates Steady Is Already Hawkish Oil prices undoubtedly complicate the Federal Reserve’s policy decisions. However, higher energy prices alone do not necessarily justify additional rate hikes. The report argues that maintaining current policy rates should itself be interpreted as a hawkish stance. Financial conditions remain sufficiently restrictive, and policymakers do not require another rate increase merely to reinforce credibility. Current market pricing still reflects expectations for at least one additional 25-basis-point increase before year-end. Nevertheless, for the Federal Reserve to actually tighten further, officials would need convincing evidence that existing interest rates are no longer restrictive enough to control inflation. That threshold appears increasingly difficult to reach. If higher oil prices primarily reflect geopolitical risk premiums rather than structural supply shortages, their inflationary impact is likely to prove temporary rather than persistent. Absent accelerating core inflation, sustained wage growth, or deteriorating inflation expectations, the economic justification for further tightening remains limited. From an investment perspective, monetary policy continues to influence valuation multiples primarily through the discount rate rather than through fundamental earnings deterioration. AI Enters a New Phase: From Rewarding Investment to Demanding Returns Perhaps the most significant shift occurring today lies within the AI industry itself. For nearly two years, investors enthusiastically rewarded companies willing to spend aggressively on AI infrastructure. That environment is changing. Strong quarterly results from major cloud providers continue to demonstrate robust revenue growth, expanding operating margins, and healthy enterprise demand. Yet investors increasingly focus on what comes after impressive revenue growth. Capital expenditure guidance. Free cash flow. External financing requirements. Return on invested capital. Google’s latest results illustrate this transition particularly well. Revenue growth remained strong, cloud demand continued expanding, and order backlogs suggested healthy future activity. Nevertheless, investors concentrated on a different development: sharply rising capital expenditures and negative free cash flow. The report notes that Google’s quarterly capital spending approached $45 billion, nearly doubling from the previous year, while free cash flow turned negative for the first time since becoming a public company. Importantly, Google is not alone. Amazon and Oracle had already entered negative free cash flow territory as AI infrastructure spending accelerated. This represents a profound shift in investor psychology. Historically, technology companies functioned as cash-generating businesses capable of funding buybacks, dividends, and continued innovation simultaneously. Today, shareholders are effectively being asked to finance tomorrow’s opportunities before receiving yesterday’s rewards. Like building an interstate highway system, enormous capital must be deployed years before traffic eventually generates meaningful economic returns. The market is therefore beginning to distinguish between companies merely spending aggressively and those demonstrating a credible pathway toward monetization. Rising Leverage Increases Sensitivity to Interest Rates Another structural development deserves close attention. The largest cloud providers are gradually transitioning from internally funded investment toward external financing. The report estimates that AI-related bond issuance during 2026 has exceeded approximately $500 billion, while capital expenditures among leading cloud providers have surpassed $700 billion. Total AI-related investment across the United States is approaching $1 trillion. Greater leverage naturally increases sensitivity to interest rates. Although credit spreads among highly leveraged AI infrastructure firms have widened, broader technology credit markets remain relatively
Beyond CPI: Why Kevin Warsh’s Inflation Revolution Could Redefine Federal Reserve Policy
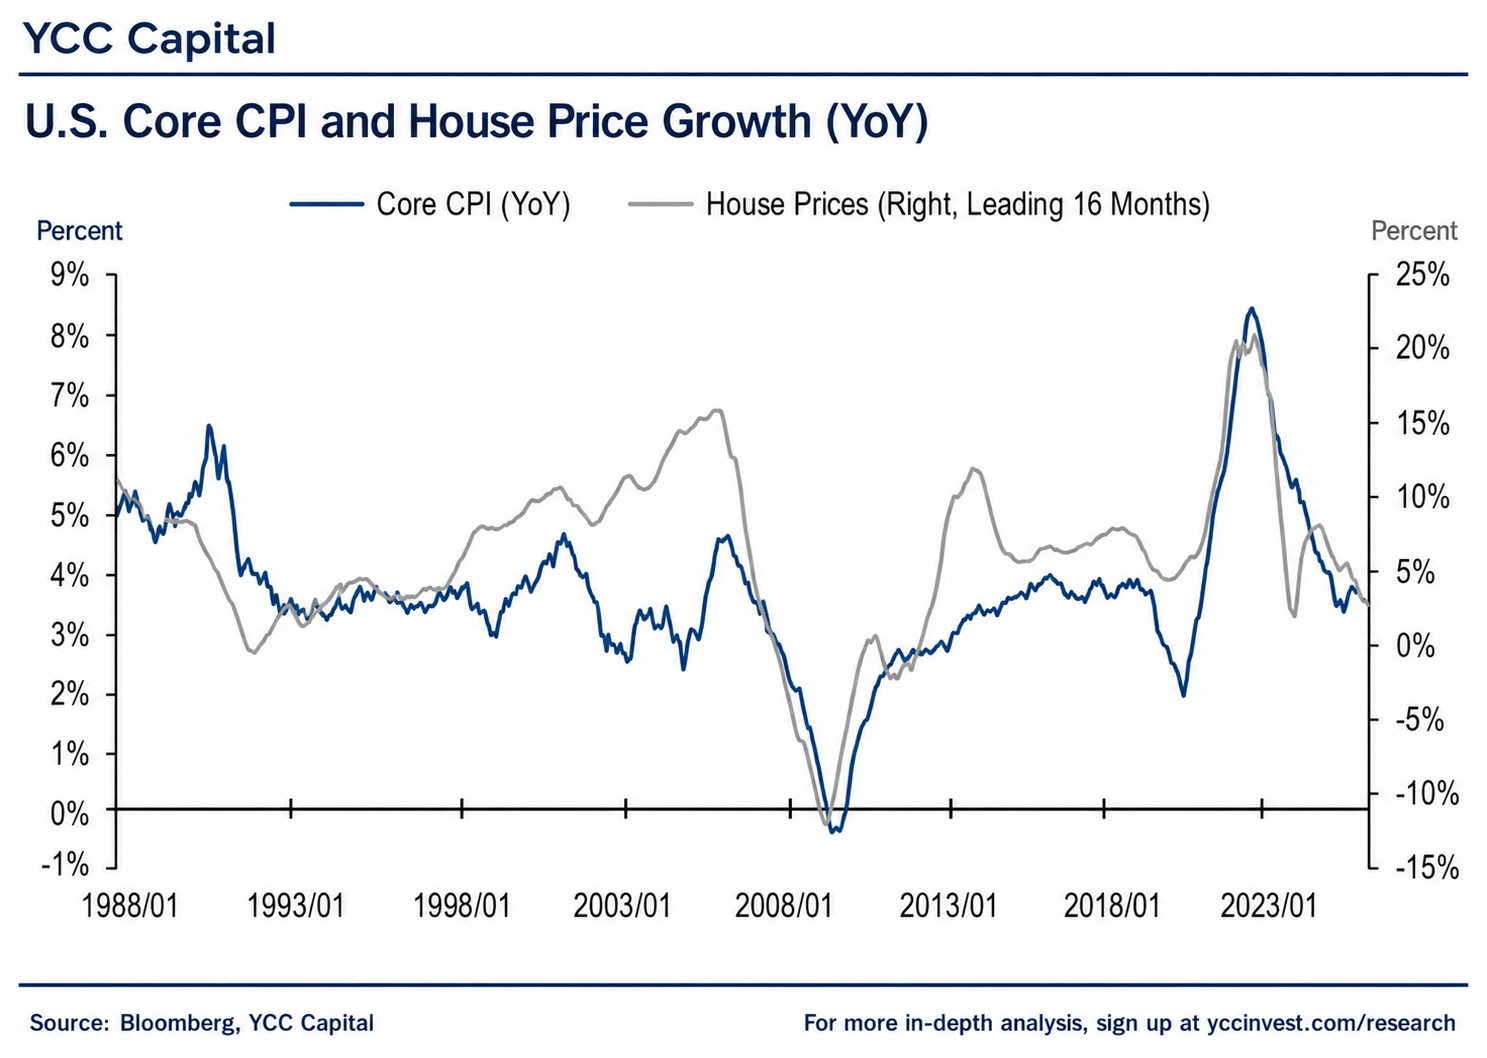
YCC CAPITAL U.S. Themes & Strategy July 29, 2026 Executive Summary Inflation is often compared to the dashboard of a car. Investors obsess over the speedometer, yet experienced drivers know that watching only one gauge can be dangerous. Engine temperature, fuel consumption, road conditions, and weather frequently matter just as much. For more than a decade, financial markets have largely treated CPI and PCE as America’s economic speedometer. Every monthly release has generated violent swings across Treasury yields, equities, currencies, and commodities. YCC Capital believes this framework is approaching an inflection point. Under Chairman Kevin Warsh’s emerging reform agenda, the Federal Reserve appears increasingly willing to modernize not only how it conducts monetary policy but also how it measures inflation itself. Rather than relying heavily on a handful of backward-looking indicators designed decades ago, the Fed is likely to transition toward a broader ecosystem of statistical measures, structural inflation models, and high-frequency private-sector datasets. Such a transition would represent one of the most consequential institutional changes since the Fed formally adopted its 2% inflation target. The immediate implication is not simply better inflation measurement—it is a fundamental shift in how markets interpret incoming data. Investors may gradually move away from reacting to a single monthly CPI surprise and instead focus on persistent inflation trends, demand-driven price pressures, labor-market dynamics, and the breadth of inflation across the economy. Why Traditional Inflation Measures Need Modernization The Federal Reserve currently relies primarily on two official measures of inflation: Consumer Price Index (CPI), published by the Bureau of Labor Statistics. Personal Consumption Expenditures Price Index (PCE), produced by the Bureau of Economic Analysis. Although PCE remains the Fed’s formal inflation target, both indicators were designed around statistical frameworks that increasingly struggle to capture a rapidly evolving digital economy. Much like navigating today’s traffic using a map printed twenty years ago, these indicators remain useful—but they no longer provide the complete picture. YCC Capital believes three structural shortcomings explain why reform has become increasingly necessary. 1. Spending Weights Adjust Too Slowly The CPI continues to rely on expenditure weights that are updated only annually and reflect consumer spending patterns from roughly two years earlier. This creates a well-known substitution bias. Consumers naturally respond to inflation by purchasing cheaper alternatives when prices rise. However, an index built using outdated spending weights continues assuming households purchase the same basket of goods regardless of changing behavior. Consequently, CPI often overstates actual inflation during periods of rapid price adjustment. By comparison, PCE updates its expenditure weights quarterly and therefore captures consumer substitution more effectively. Even so, neither measure fully reflects today’s increasingly dynamic consumption patterns. For policymakers attempting to calibrate interest rates precisely, this lag can produce systematic policy errors. 2. Methodological Distortions Create Significant Measurement Errors Housing illustrates perhaps the largest weakness. Shelter represents the single biggest component of CPI, yet official shelter inflation typically trails real market rents by roughly 12 to 18 months. The reason is structural rather than statistical. Most American leases renew annually, meaning existing tenants continue paying yesterday’s rents while only new leases reflect today’s market conditions. Meanwhile, the Bureau of Labor Statistics surveys rental units on rotating schedules that require months before new pricing is incorporated into official data. The result resembles steering a ship while looking through the rear-view mirror. Even after market rents begin falling, official shelter inflation frequently continues rising. Healthcare presents another distortion. Rather than measuring what households actually pay for insurance premiums, CPI largely estimates insurance costs through insurers’ retained earnings. During extraordinary periods such as the pandemic, changing medical utilization dramatically altered insurer profitability, causing CPI’s health insurance component to swing wildly despite consumers experiencing much smaller changes in actual insurance costs. Such methodological quirks have occasionally influenced financial markets far more than underlying inflation fundamentals justified. 3. Artificial Intelligence Is Challenging Traditional Price Measurement Perhaps the most important future challenge lies in measuring technological progress. Historically, government statisticians adjusted prices for improvements in product quality through hedonic adjustments. For example, if a computer processor became 30% more powerful while its price also increased 30%, economists would conclude that its effective price had not changed because consumers received proportionally greater value. Generative AI complicates this framework considerably. Software subscriptions increasingly bundle sophisticated AI capabilities into existing products. Consumers may pay slightly higher subscription fees, but those increases often reflect dramatically expanded functionality rather than traditional inflation. Current CPI and PCE methodologies only partially capture these quality improvements. As AI becomes embedded throughout enterprise software, productivity tools, education, healthcare, and professional services, distinguishing genuine inflation from improvements in product quality will become increasingly difficult. Recent Federal Reserve research suggests that correcting these measurement issues would produce meaningfully lower estimates of both Core PCE and Core Goods inflation, reinforcing the argument that official inflation statistics may currently overstate underlying price pressures in certain technology-intensive sectors. The Next Generation of Inflation Indicators Rather than replacing CPI and PCE outright, Warsh’s likely strategy appears focused on supplementing them with more sophisticated analytical tools. These can be grouped into three broad categories. Statistical Measures That Remove Noise Traditional inflation reports often suffer from extreme monthly volatility caused by energy prices, weather events, supply disruptions, or isolated product categories. Several Federal Reserve Banks have already developed statistical techniques designed to filter out this noise. Among the most influential are: Median Inflation Trimmed Mean CPI Trimmed Mean PCE Sticky Price Inflation Diffusion Indexes Median and trimmed-mean measures remove the most extreme monthly price movements before calculating overall inflation, producing considerably smoother estimates of underlying price trends. Sticky inflation measures focus on prices that change infrequently, providing insight into long-term inflation expectations rather than temporary fluctuations. Diffusion indexes examine how broadly inflation is spreading across the economy instead of measuring only the magnitude of price increases. Broad-based inflation is generally more persistent—and therefore more relevant for monetary policy—than isolated price spikes. These statistical measures effectively reduce the “noise” surrounding monthly inflation releases, allowing policymakers to focus on persistent signals rather than temporary volatility.
The Cooling Beneath the Surface: Why America’s Labor Market Is Losing Momentum Without Breaking
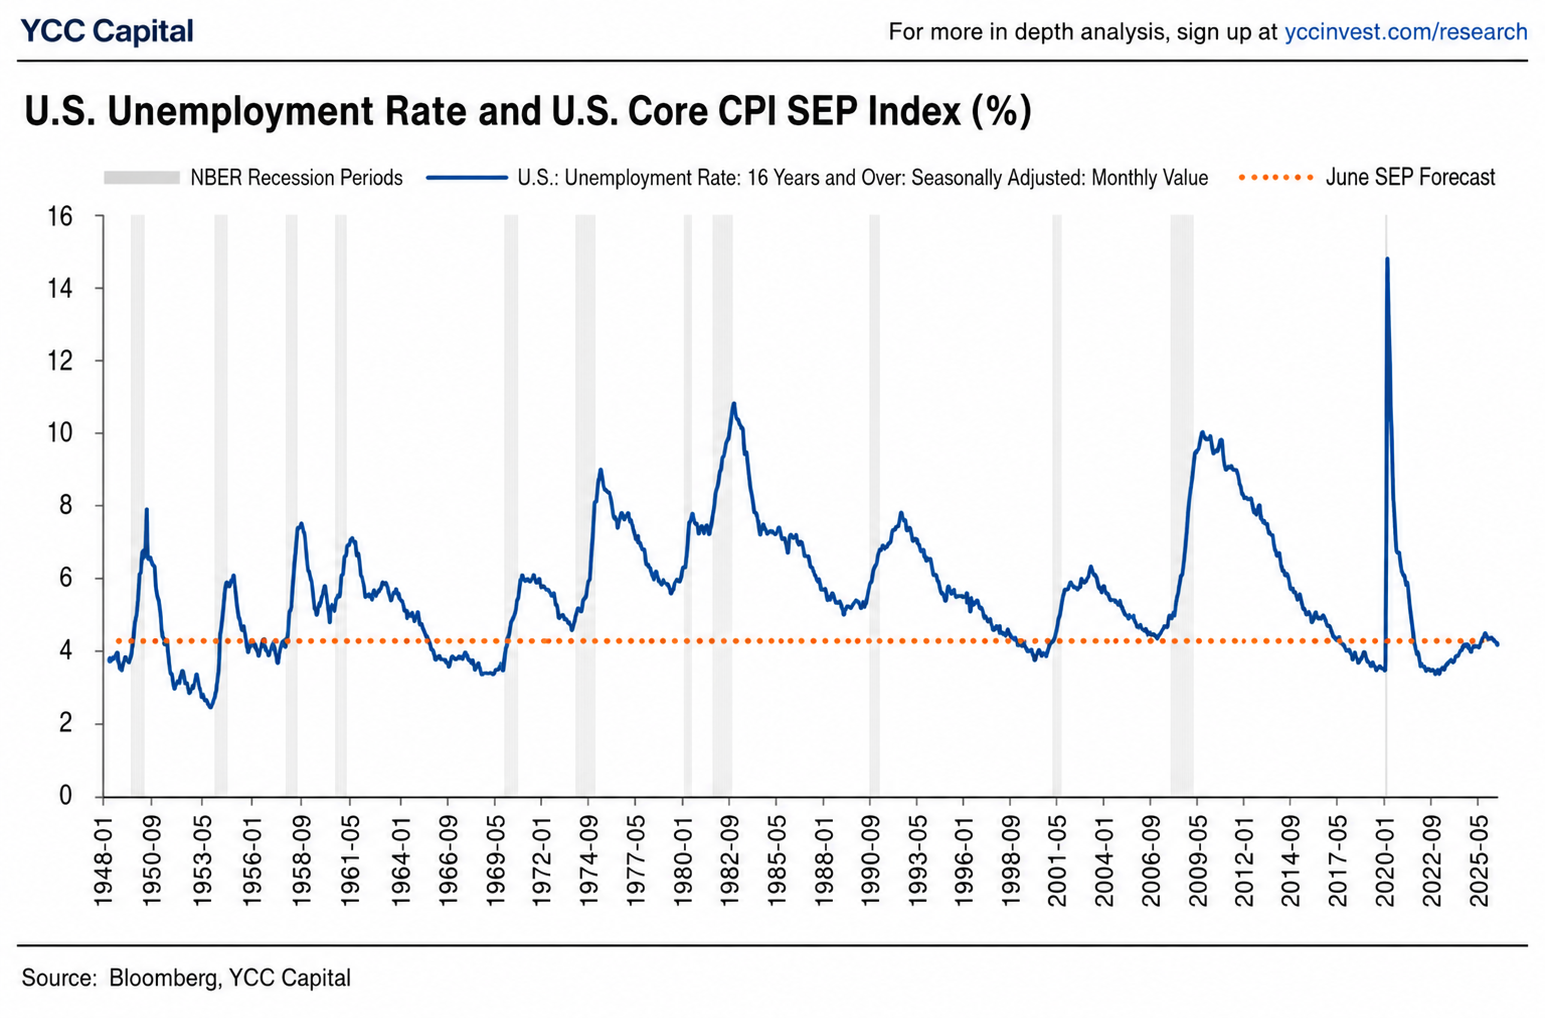
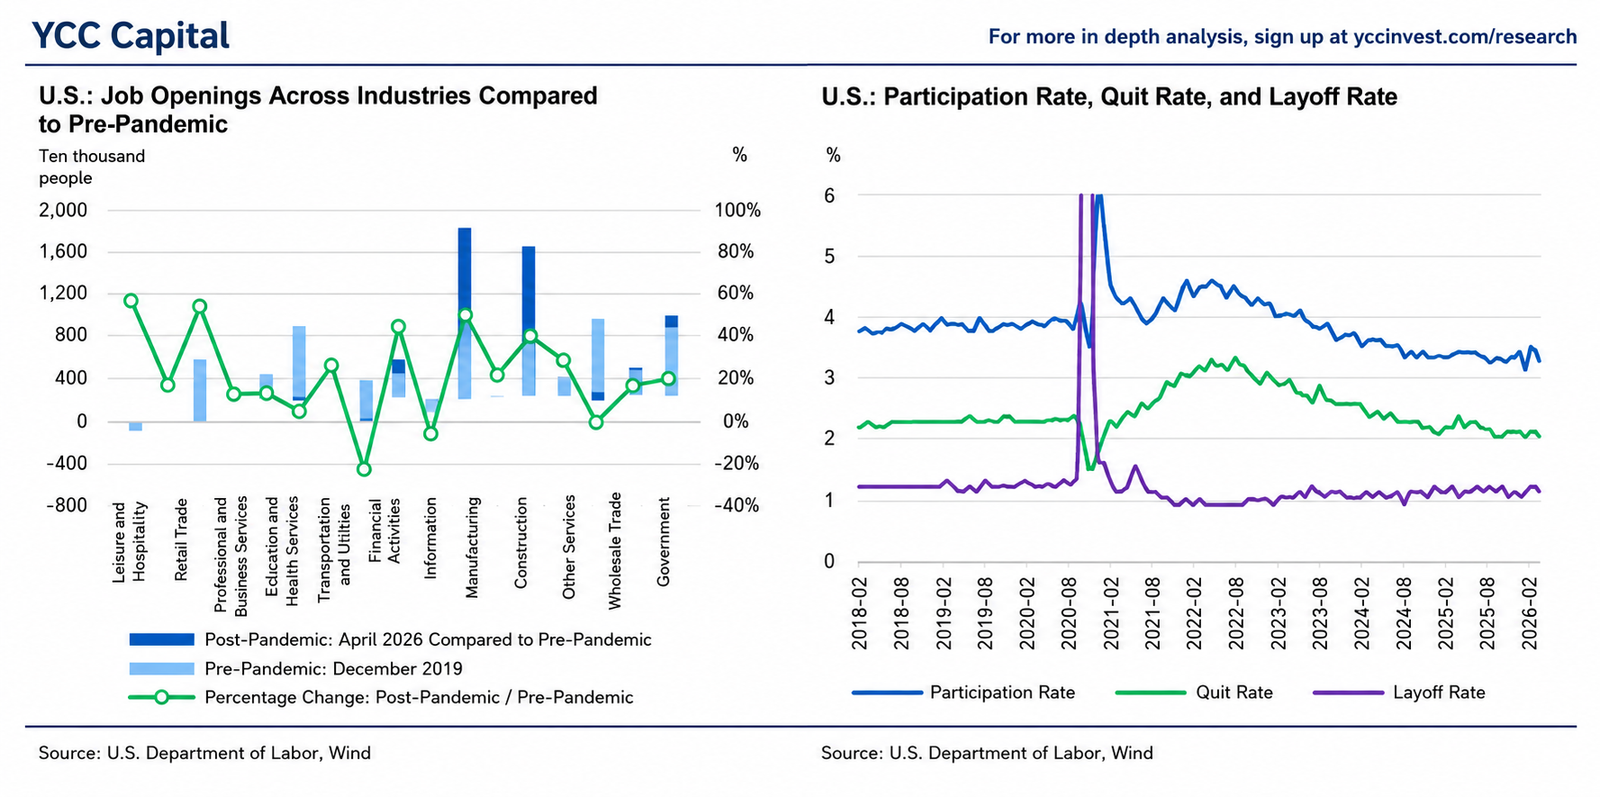
YCC CAPITAL U.S. Themes & Strategy A Softer Employment Picture Lowers the Odds of Further Fed Tightening, but the Path to Rate Cuts Remains Narrow July 9, 2026 Executive Summary For many households, the labor market is the economy they experience every day. It determines whether a recent graduate lands their first job, whether a mid-career engineer feels confident changing employers, or whether a small business owner decides to expand payroll. Financial markets may celebrate lower inflation or stronger earnings, but employment ultimately determines whether economic momentum feels real. June’s U.S. employment report suggests that this everyday economy is gradually cooling. The deterioration is not dramatic enough to imply recession, yet it is broad enough to indicate that the labor market has entered a new phase characterized by slower hiring, weaker labor-force participation, and increasingly cautious corporate behavior. Nonfarm payrolls rose by just 57,000, well below both consensus expectations of 110,000 and the previous month’s 172,000 increase. Even more importantly, April and May payrolls were revised downward by a combined 74,000, reinforcing the message that employment momentum has been fading for several months rather than collapsing suddenly. At first glance, the decline in the unemployment rate to 4.2% appears encouraging. A closer examination tells a different story. Rather than reflecting stronger hiring, the improvement was driven primarily by a fall in labor-force participation from 61.8% to 61.5%, meaning many workers simply exited the labor market altogether. From YCC Capital’s perspective, the report reinforces a theme that has gradually emerged throughout 2026: the U.S. economy is not overheating anymore, but neither is it sliding into recession. Instead, it is settling into a slower-growth equilibrium in which businesses are increasingly reluctant to both hire and fire while the Federal Reserve remains constrained by sticky wage inflation. The Headline Payroll Miss Masks a Broader Loss of Momentum The most striking feature of June’s employment report was not simply the weak headline figure but the consistency of weakness across multiple indicators. Payroll growth slowed to just 57,000, marking one of the weakest monthly gains since the post-pandemic recovery began. The downward revisions to previous months significantly altered the underlying trend, reducing the three-month average employment gain to levels substantially below those recorded earlier this year. Taken together, the latest data suggest that the U.S. labor market is no longer experiencing merely a temporary slowdown. Instead, hiring demand has entered a sustained moderation phase. Importantly, layoffs remain relatively contained. Rather than aggressively reducing headcount, companies appear increasingly willing to postpone recruitment while maintaining existing employees. This distinction matters because recessions typically begin with accelerating layoffs, whereas today’s environment resembles an economy caught in a prolonged hiring freeze. Corporate America appears increasingly comfortable waiting for greater clarity regarding inflation, interest rates, artificial intelligence adoption, and consumer demand before making long-term staffing commitments. Falling Unemployment Is More Illusion Than Improvement Perhaps the most misleading headline was the decline in the unemployment rate. Normally, falling unemployment signals strengthening labor demand. June’s data tell a very different story. The labor-force participation rate declined to 61.5%, indicating that labor supply contracted even faster than labor demand. As workers exited the workforce, the unemployment rate mechanically declined despite only modest job creation. This distinction carries important policy implications. A healthier labor market would generate falling unemployment because businesses are hiring aggressively. Today’s labor market instead reflects declining participation, suggesting that many individuals are simply choosing—or being forced—to stop searching for work. Measured differently, labor supply has now fallen below labor demand by approximately 287,000 workers, a wider imbalance than observed only two months earlier. This shift reflects a cooling market rather than a stronger one. Hiring Has Become Increasingly Uneven The employment slowdown was particularly evident across service industries, where hiring weakened substantially. Private-sector payrolls increased by only 49,000, dramatically below the recent three-month average of approximately 150,000. Within the goods-producing sectors, conditions remained relatively resilient. Construction employment expanded by 11,000, while manufacturing added 3,000 jobs. These gains suggest that infrastructure investment and ongoing industrial reshoring continue to provide a modest cushion against broader economic slowing. Services, however, told a more complicated story. Professional and business services remained among the strongest contributors, adding 36,000 jobs and extending six consecutive months of positive employment growth. Education and healthcare once again demonstrated remarkable resilience by creating 69,000 new positions, reflecting demographic demand that remains relatively insulated from short-term economic cycles. Consumer-facing industries painted a less encouraging picture. Leisure and hospitality employment plunged by 61,000 following an unusually strong gain during the previous month that had likely been boosted by temporary World Cup-related tourism demand and seasonal hiring. Trade, transportation, and utilities also slipped into negative territory, suggesting softer consumer spending and moderating logistics demand. Government hiring similarly lost momentum as local government employment slowed sharply, reducing an important source of recent payroll support. Artificial Intelligence Is Beginning to Reshape White-Collar Employment One increasingly notable feature of the current labor market is the growing divergence between traditional employment indicators and technological change. The information sector lost 9,000 jobs during June, extending an already weakening trend. According to Challenger data, artificial intelligence has now been cited as a leading reason for technology-sector layoffs for four consecutive months, with technology accounting for nearly one-third of announced job reductions this year. While AI is unlikely to produce economy-wide labor displacement overnight, its influence is becoming increasingly visible within high-income knowledge industries. Companies appear to be slowing recruitment while simultaneously increasing investment in automation, particularly across software development, administrative functions, customer support, and data analysis. Rather than eliminating millions of jobs immediately, AI’s first macroeconomic effect may simply be reducing the need to replace departing employees. That process is already beginning to appear within today’s hiring data. Businesses Prefer Fewer Hours to More Layoffs One encouraging aspect of the report is that employers continue to avoid aggressive workforce reductions. Average weekly hours worked remained stable at 34.3 hours, while manufacturing hours eased only slightly from 40.4 to 40.3 hours. Historically, employers often reduce overtime and working hours
America’s Second Engine How AI Investment Is Rewriting the U.S. Economic Cycle While the Federal Reserve Recalibrates Its Inflation Fight
YCC CAPITAL U.S. Themes & Strategy June 26, 2026 Executive Summary Every economic expansion eventually reveals its true engine. During the 1990s it was the internet. In the decade following the Global Financial Crisis, ultra-low interest rates and abundant liquidity became the dominant force behind asset appreciation. Today, the United States appears to be entering another defining chapter. Artificial intelligence is no longer merely a technological breakthrough—it has become an increasingly important macroeconomic driver. This shift explains why traditional indicators often appear contradictory. Manufacturing remains uneven, housing continues to struggle under elevated financing costs, consumers are becoming more selective in their spending, and fiscal deficits remain historically large. Yet economic growth has proven remarkably resilient. The missing piece is a historic wave of AI-related capital expenditure that is reshaping corporate investment behavior and offsetting weakness elsewhere in the economy. From YCC Capital’s perspective, the United States is transitioning from a consumer-led recovery toward an investment-led expansion centered on digital infrastructure, advanced computing, software, semiconductors, and industrial modernization. This transformation is unlikely to be linear. Inflation pressures generated by energy markets and fiscal stimulus continue to complicate monetary policy, forcing the Federal Reserve into an increasingly difficult balancing act. Nevertheless, the underlying structure of the U.S. economy remains considerably healthier than many investors appreciate. The coming twelve months are therefore unlikely to resemble either the rapid post-pandemic rebound or a conventional late-cycle slowdown. Instead, investors should prepare for an economy characterized by uneven sectoral performance, structurally elevated capital spending, and monetary policy that remains considerably tighter than markets previously anticipated. YCC Perspective Economic transitions rarely announce themselves clearly. They often begin quietly, with investment patterns changing long before headline growth statistics capture the transformation. The current U.S. cycle resembles this process. Consumers are no longer providing the overwhelming momentum they did immediately after the pandemic reopening. Instead, businesses have increasingly assumed the role of primary growth driver. Much like the construction of America’s interstate highway system or the nationwide electrification projects of previous generations, today’s AI infrastructure buildout represents investment whose economic impact extends far beyond the companies making the initial expenditures. Every new hyperscale data center requires electricity, transmission networks, advanced cooling systems, industrial equipment, logistics services, specialized construction, networking hardware, and increasingly sophisticated software ecosystems. What appears initially as technology investment gradually spreads across manufacturing, utilities, transportation, engineering, and professional services. The multiplier effect becomes increasingly visible across the broader economy. For investors, this distinction matters enormously. Market participants continue debating whether the United States is approaching recession or achieving a soft landing. We believe this framing misses the more important structural development. The economy is not simply slowing or accelerating—it is changing its composition. That composition increasingly favors productivity-enhancing investment over debt-fueled consumption. The U.S. Economy Is Becoming Increasingly Bifurcated Headline GDP growth has moderated compared with the exceptionally strong expansion experienced during the post-pandemic recovery. Yet beneath the aggregate figures lies a much more nuanced story. Traditional interest-rate-sensitive sectors continue to experience significant pressure. Residential construction remains constrained by elevated mortgage rates. Smaller businesses face tighter financing conditions. Conventional manufacturing outside technology-related industries continues to grow only modestly. At the same time, investment linked to artificial intelligence has accelerated across multiple categories. Spending on equipment, software, intellectual property products, semiconductor manufacturing, cloud infrastructure, and digital communications continues expanding at a pace that more than offsets weakness elsewhere. The result is effectively a two-speed economy. One economy continues operating under the weight of restrictive monetary policy, elevated financing costs, and lingering trade uncertainties. The other benefits from one of the largest private investment cycles witnessed in decades. This divergence explains why recession forecasts have repeatedly failed to materialize despite widespread expectations of slower growth. Aggregate activity has remained supported because AI-related investment possesses both exceptional scale and unusually broad supply-chain spillover effects. Unlike speculative investment booms that primarily inflate financial assets, current AI expenditures increasingly translate into tangible physical infrastructure. New manufacturing facilities, energy infrastructure, data centers, industrial automation, and enterprise software deployment collectively generate sustained demand across multiple industries. From a macroeconomic perspective, this distinction significantly improves the durability of the current expansion. Consumption Is Losing Momentum—but Not Collapsing Consumer spending remains the largest contributor to U.S. economic activity. Accordingly, any assessment of the business cycle must begin with household demand. Recent data suggest that consumption continues to expand, albeit at a noticeably slower pace than during the previous year. Households have become increasingly selective regarding discretionary purchases, particularly goods affected by higher import costs and tariff-related price pressures. Services consumption remains comparatively resilient, supported by continued employment gains and healthy household balance sheets. This moderation should not be interpreted as a collapse in demand. Rather, consumers appear to be adapting to a world where borrowing costs remain elevated and purchasing power faces renewed pressure from energy prices. Households are adjusting their spending patterns instead of dramatically reducing expenditures altogether. A useful analogy is a family undertaking a long road trip. When fuel prices suddenly increase, few travelers abandon the journey entirely. Instead, they choose fewer unnecessary stops, dine out less frequently, and plan their route more carefully. The destination remains unchanged; only the pace of spending evolves. The U.S. consumer is behaving in much the same way. Higher energy prices effectively operate as an economy-wide tax, gradually absorbing disposable income that would otherwise support discretionary purchases. Consequently, wage growth that once comfortably exceeded inflation has narrowed considerably. Although aggregate consumption remains positive, the composition of spending continues shifting toward essential services while discretionary categories recover more gradually. This transition is consistent with an economy entering a more mature stage of expansion rather than approaching an imminent recession. Household Balance Sheets Remain a Critical Source of Stability One of the most overlooked characteristics of the current expansion is the remarkable strength of household balance sheets. While public discussion often centers on rising credit card balances or concerns surrounding consumer debt, the broader financial picture remains considerably healthier than headline narratives suggest. Household leverage has gradually declined
The Warsh Shock: The Fed’s Hawkish Reset Forces a Full Market Repricing
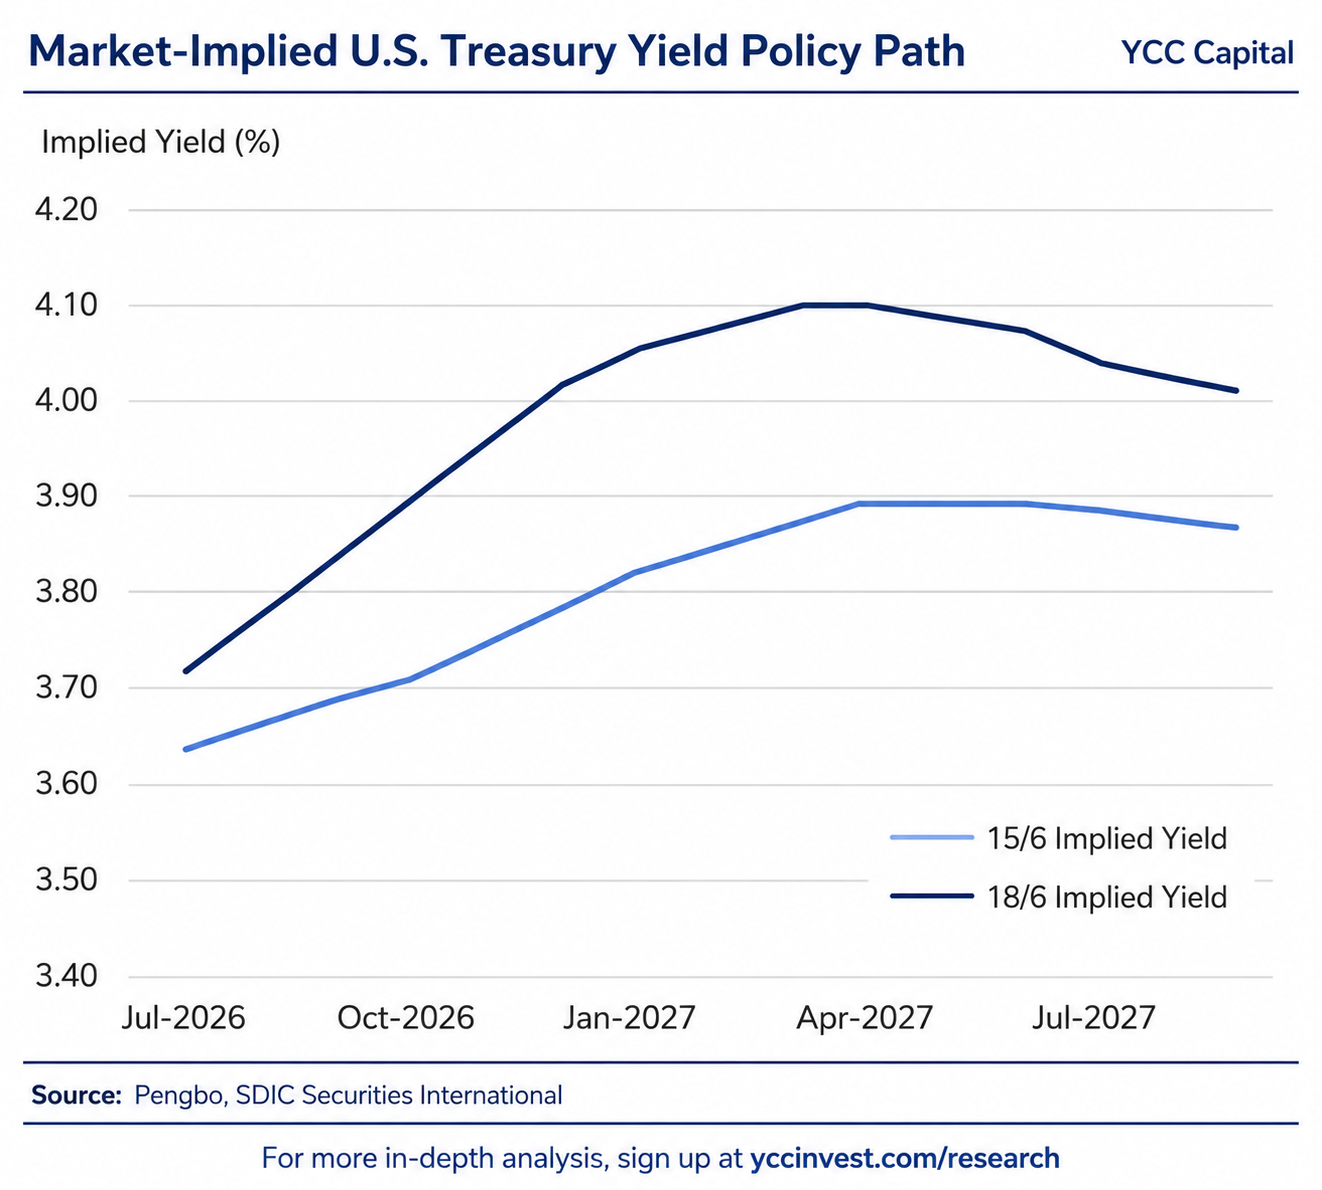
YCC CAPITAL U.S. Themes & Strategy ──────────────────────────────────────── June 25, 2026 Executive Summary Financial markets occasionally encounter moments when a central bank decision changes not merely the policy outlook, but the entire framework through which investors interpret economic data. The June Federal Open Market Committee meeting appears to be one of those moments. Although the Federal Reserve left its policy rate unchanged at 3.50%–3.75%, the market’s attention quickly shifted away from the rate decision itself and toward a broader institutional transformation taking place under newly appointed Chair Kevin Warsh. The meeting delivered a distinctly hawkish signal, triggering one of the sharpest short-end Treasury selloffs in recent years and forcing investors to substantially reprice future rate expectations. The immediate reaction resembled a sudden recalibration of the market’s compass. Investors entered the meeting expecting a gradual path toward easing. They emerged confronting a Federal Reserve openly discussing additional tightening while simultaneously reducing forward guidance and emphasizing policy flexibility. The result was dramatic: Two-year Treasury yields surged. Rate futures rapidly priced in additional hikes. The Treasury curve flattened. Equity markets were forced to reassess valuation assumptions. The probability of a prolonged higher-rate environment increased materially. At YCC Capital, we believe the key takeaway is not merely that rates may rise further. The deeper story is that markets are being asked to adapt to a fundamentally different communication regime. The End of the Powell Era Communication Model The June 17 FOMC meeting represented the first major policy appearance of Chair Kevin Warsh. The Committee voted unanimously to maintain rates at 3.50%–3.75%. However, the statement itself underwent substantial revision. Large portions of the previous forward-guidance language were removed, and notably, Warsh declined to submit his own economic projections or dot-plot forecast. This marks a significant break from the practices established under Ben Bernanke, Janet Yellen, and Jerome Powell. For more than a decade, investors became accustomed to extraordinary transparency from the Federal Reserve. Markets frequently received detailed guidance regarding future policy intentions. Under Warsh, that model appears to be ending. His long-standing skepticism toward excessive forward guidance is now translating into policy reality. The implication is profound. Investors may no longer receive the same level of certainty regarding the future path of rates. As a result, market volatility may increasingly reflect evolving data rather than central bank signaling. In practical terms, markets must now do more of the forecasting work themselves. The Dot Plot Sends a Clear Hawkish Message The updated Summary of Economic Projections delivered the strongest surprise. Among eighteen participants: Nine expect at least one rate hike this year. Six anticipate at least 50 basis points of additional tightening. Eight expect rates to remain unchanged. Only one projects a rate cut. Just three months earlier, the median expectation was for a rate reduction. Even excluding Warsh’s influence, the Committee appears almost evenly split between those favoring additional tightening and those preferring stability or easing. The balance of power inside the Fed has clearly shifted. This is not a central bank preparing for recession. It is a central bank increasingly concerned that inflation risks remain underappreciated. Inflation Forecasts Move Sharply Higher The Fed’s inflation projections underwent significant upward revision. For year-end 2026: Headline PCE inflation rose from 2.7% to 3.6%. Core PCE inflation increased from 2.7% to 3.3%. Interestingly, the 2027 inflation forecast moved only modestly higher to approximately 2.3%. This suggests policymakers largely view the recent inflation acceleration—particularly energy-related price pressures stemming from Middle East tensions and oil market disruptions—as temporary rather than structural. The distinction matters enormously. If policymakers believed inflation had become entrenched, long-term forecasts would have risen far more aggressively. Instead, the Fed appears to be communicating a different message: Inflation is problematic today, but still controllable over time. Growth Remains Resilient The Fed’s growth outlook remains surprisingly constructive. 2026 GDP growth expectations were reduced only slightly, from 2.4% to 2.2%. Meanwhile, the unemployment rate projection improved marginally from 4.4% to 4.3%. Taken together, these forecasts effectively reject the hard-landing narrative that many investors anticipated earlier in the year. The Fed is telling markets that it believes the economy can withstand somewhat tighter financial conditions. This is a critical distinction because it provides policymakers with political and economic room to tighten further if inflation remains elevated. Treasury Markets Experience Violent Repricing Bond markets reacted immediately. The two-year Treasury yield jumped approximately 12 basis points in a single session, marking one of the largest FOMC-day increases since the Global Financial Crisis. Rate futures underwent an equally dramatic adjustment. Prior to the meeting, markets assigned only about a 27% probability to a September hike. Within days, that probability surged to approximately 83%. October contracts moved to fully price an additional hike, while cumulative tightening expectations through year-end climbed to roughly 155 basis points of implied tightening. Such abrupt repricing underscores how unprepared investors were for the Fed’s hawkish pivot. Why the Yield Curve Flattened One of the most important developments was the divergence between short-term and long-term yields. While front-end Treasury yields surged, 30-year yields actually declined. At first glance, this may appear contradictory. In reality, it reflects confidence in the Fed’s inflation-fighting credibility. Investors appear willing to accept higher short-term rates because they believe those higher rates will ultimately succeed in containing inflation over the long run. Consequently, long-term inflation premiums fell. However, investors should not become complacent. History demonstrates that persistent flattening—or eventual inversion—often signals growing concern that policy may become excessively restrictive. The risk of policy overshoot is not yet dominant, but it is increasingly being incorporated into market pricing. Three Issues Investors Must Monitor 1. Warsh’s Five Reform Working Groups Chair Warsh announced five major review initiatives focused on: Federal Reserve communications. Balance sheet policy. Data reliability. Productivity and labor markets. Inflation frameworks. Most findings are expected before year-end. The balance sheet review is particularly important because it could reshape the current ample-reserves framework governing approximately $6.7 trillion of liquidity. Markets increasingly expect a gradual but meaningful shift toward continued quantitative tightening. 2. July and September FOMC Meetings
The World Cup Jobs Boom: Reality, Hype, and What FIFA 2026 Means for the U.S. Labor Market
YCC CAPITAL U.S. Themes & Strategy June 21, 2026 Executive Perspective When a major sporting event arrives, the economic narrative often follows a familiar script: packed hotels, crowded airports, booming restaurants, and a wave of new jobs. The story is intuitive and compelling. Yet history suggests reality is often more nuanced. The 2026 FIFA World Cup, jointly hosted by the United States, Canada, and Mexico, will be the largest World Cup ever staged. With 48 teams, 104 matches, and an estimated 6.5 million spectators, it will undoubtedly create a visible surge in activity across host cities. The key question for investors, policymakers, and Federal Reserve officials is whether this surge translates into a meaningful and lasting improvement in U.S. employment. Our analysis suggests the answer is: yes, but only modestly. The World Cup is likely to create a measurable temporary boost to employment, particularly in hospitality, transportation, security, logistics, local government, and business services. However, historical evidence from the 1994 U.S. World Cup suggests that headline job-creation estimates are frequently overstated. The economic impact tends to be concentrated in specific regions and sectors, while substitution and crowding-out effects dilute gains elsewhere. At YCC Capital, we view the World Cup as a useful case study in distinguishing between visible economic activity and lasting macroeconomic impact. A city can feel dramatically busier for six weeks without materially altering the trajectory of national employment growth. Sources: Bloomberg, YCC Capital. Based on analysis of the underlying research report. Key Conclusions Our Core Findings Recent U.S. labor-market strength reflects both cyclical economic improvement and World Cup-related temporary hiring. Historical evidence from the 1994 World Cup indicates employment gains were significantly smaller than promotional forecasts. The 2026 tournament may add approximately 72,000 jobs on a quarterly basis through GDP-related effects. FIFA estimates approximately 185,000 full-time-equivalent jobs will be supported in the United States. Actual realized employment effects are likely substantially lower than headline projections. The Federal Reserve will likely treat any World Cup-related labor strength as temporary noise rather than structural labor-market tightening. Recent U.S. Labor Market Strength Has Surprised Expectations The U.S. labor market has recently delivered a series of upside surprises, challenging the consensus view that labor demand was steadily cooling. Several developments stand out: Job Openings Rebounded Sharply April JOLTS data showed a significant increase in nonfarm job openings, rising to approximately 7.61 million positions. The job-opening rate climbed to 4.6%, significantly exceeding market expectations. Importantly, labor demand once again exceeded labor supply after several months of relative slack. The most notable increase occurred in Professional and Business Services, where openings surged by roughly 668,000 positions. This category often captures: Temporary staffing Event management Security services Media support Logistics outsourcing These are precisely the types of positions that tend to expand ahead of mega-events such as the World Cup. Payroll Growth Accelerated May nonfarm payrolls increased by approximately 172,000 jobs, more than double consensus expectations. Previous months were also revised upward. A closer examination reveals that government employment played a significant role. Local governments added workers at a pace consistent with: Event preparation Public safety coordination Transportation management Temporary administrative staffing Meanwhile, construction and manufacturing also contributed positively amid continued investment spending and defense-related production growth. Unemployment Remains Stable The unemployment rate edged down to approximately 4.3%. At the same time: Labor-force participation remains historically subdued. Temporary unemployment declined. Wage growth moderated year-over-year but accelerated on a monthly basis. These dynamics suggest labor-market resilience without signaling a broad overheating cycle. Why the Labor Market Is Stronger Than Expected We identify two primary drivers. 1. Temporary World Cup-Related Hiring Evidence points toward pre-event staffing activity in: Local governments Hospitality Professional services Transportation Security Event operations This hiring is real, but much of it is temporary. Think of the World Cup labor surge as a temporary bridge rather than a new highway. Workers are added to support a concentrated burst of demand, but many positions disappear once the event concludes. 2. An Investment-Led Economic Expansion The second factor is more important. The U.S. economy continues to exhibit characteristics of an investment-driven cycle: AI infrastructure spending remains exceptionally strong. Data-center construction continues at record levels. Manufacturing orders have improved. Inventory rebuilding is underway. Defense-related spending remains elevated. Unlike temporary event hiring, these trends possess the potential to sustain employment growth over a longer horizon. Lessons from History: The 1994 World Cup One of the most important studies on this subject is: Baumann, Engelhardt, and Matheson (2011) Labor Market Effects of the World Cup: A Sectoral Analysis The paper examined employment outcomes in host cities during the 1994 FIFA World Cup in the United States and compared them with non-host cities. The conclusions were striking. What Researchers Expected Before the tournament, promotional forecasts suggested that each host city could gain: 5,000–8,000 new jobs. The economic narrative sounded familiar: More tourists More spending More hiring Stronger local growth What Actually Happened The statistical evidence showed that the employment impact was either insignificant or substantially smaller than advertised. Using the authors’ preferred methodology, hosting the World Cup increased employment by only: 0.112% per month Equivalent to roughly: 1,900 jobs per host city per month This was dramatically below the headline projections. The Most Surprising Result Retail employment actually declined in some host cities. This finding challenges conventional assumptions. Rather than generating entirely new spending, the tournament often redirected existing spending. A family that buys World Cup tickets may postpone other purchases. A visitor spending heavily on hotels and restaurants may spend less on retail shopping. Economic activity shifts rather than expands. Why Didn’t the 1994 World Cup Create More Jobs? The study identified three major explanations. 1. Existing Infrastructure Reduced Construction Demand Unlike Olympic Games or large-scale infrastructure programs, the 1994 World Cup required virtually no new stadium construction. Existing NFL and college football facilities were utilized instead. As a result: Construction employment gains remained limited. Infrastructure multipliers were weak. 2. Substitution Effects Local residents often redirected discretionary spending toward World Cup-related activities. Money spent on: Tickets Merchandise