YCC CAPITAL
Emerging Markets & China Strategy
October 2, 2026
China’s August data present a familiar but increasingly uncomfortable picture: industrial production retains pockets of strength, especially in advanced manufacturing, while property, household credit demand, employment and consumption remain conspicuously weak. The economy is not falling off a cliff. The more important problem is that several of its traditional transmission mechanisms are no longer working with their old force.
For investors, we see four macro variables worth watching. Oil is unlikely to sustain a move above $150 per barrel; China’s industrial output should remain positive but faces increasing pressure; the property downturn has not yet reached a convincing investment inflection point; and softer employment conditions, slowing money growth and restrictive global financial conditions continue to constrain Chinese consumption.
Recent U.S.-China talks have reduced some near-term trade friction, including a $30 billion reciprocal tariff-reduction arrangement and a new bilateral AI dialogue. These are useful stabilizers, but they do not resolve China’s domestic demand and balance-sheet problems. Investing.com
Oil: $150 Looks More Like a Tail Risk Than a Base Case
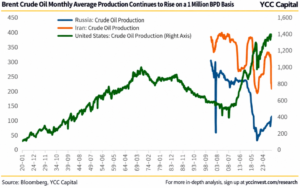
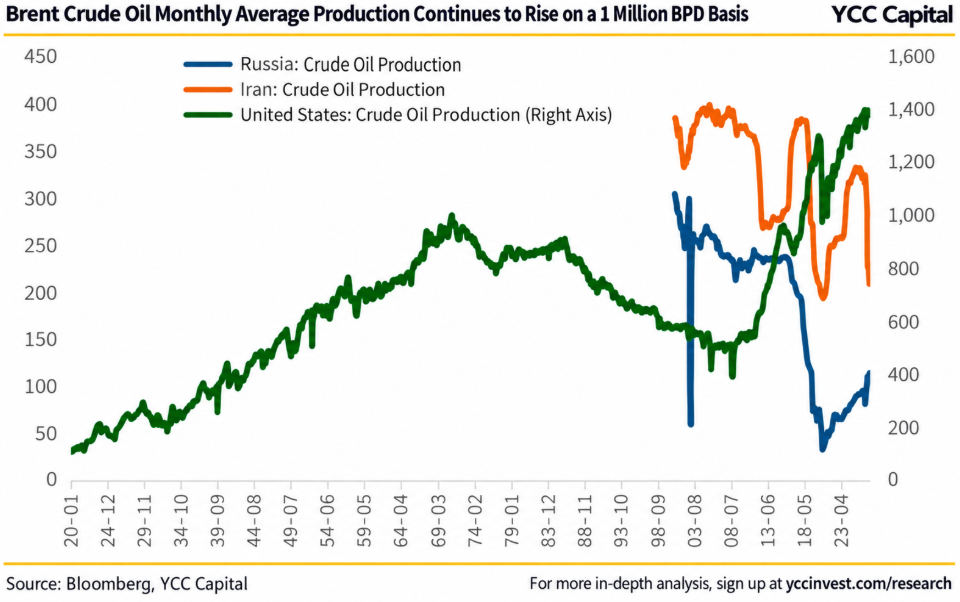
Oil has remained elevated around $90–100 per barrel amid supply disruption associated with the U.S.-Iran conflict and a stronger U.S. economy. Yet we see limited scope for crude to establish a sustained move above $150 between late 2026 and 2027.
The reason is straightforward: very high oil prices eventually become their own demand-destruction mechanism. Consumers can absorb expensive fuel for a while, just as a household can temporarily tolerate a larger electricity bill. But if that bill stays high month after month, discretionary spending adjusts. At the global level, sustained triple-digit oil prices similarly erode real income and ultimately reduce petroleum demand.
Supply is also responding. Venezuela’s monthly crude production rose progressively from above 1 million barrels per day between April and August, reaching its strongest level since early 2019. U.S. crude production remained above 13.5 million barrels per day and generally trended upward. Saudi production, after falling sharply from 10.112 million barrels per day in February to 7.626 million in March and 6.755 million in April, subsequently recovered to 7.276 million barrels per day in August.
This matters because the longer elevated prices persist, the stronger the incentive for producers outside the Persian Gulf disruption zone to fill the gap.
The monetary-policy implication is also important. If oil fails to make another dramatic upward move, U.S. inflation pressure should become less acute into 2027. That would reduce the need for additional Federal Reserve tightening after the first quarter, although historical experience argues against expecting an immediate pivot from tightening to easing. Our base framework therefore allows for restrictive U.S. rates to persist, with the next easing cycle potentially not beginning until late 2027.
For the United States, that represents a difficult but manageable adjustment rather than an inherently recessionary outcome. For China, however, high global rates arrive at an awkward moment because domestic demand is already fragile.
Industry Is Holding Up—but the Headline Conceals the Divide
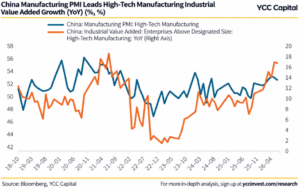
August industrial production increased 5.2% year over year, beating the 4.7% expectation and improving from 4.5% previously. Month-over-month production rose 0.54%, the strongest August sequential reading in nearly three years. Year-to-date industrial production growth held at 5.3%.
Manufacturing was the principal support. Manufacturing value-added growth accelerated to 6.1%, while mining remained weak at -1.4%. Electricity, gas and water production and supply increased 4.9%.
The brightest spot remains high technology. High-tech industrial value added expanded 16.7% year over year in August, marking a seventh consecutive month of double-digit growth and one of the strongest readings since 2021.
But investors should resist extrapolating that strength indefinitely.
Historically, China’s high-tech manufacturing PMI has tended to lead high-tech industrial output. Previous PMI troughs led corresponding industrial-output troughs by roughly four to eight months. With U.S. monetary conditions tightening at already elevated interest-rate levels, the external financial backdrop is becoming less supportive for capital-intensive and duration-sensitive technology investment.
The September U.S.-China summit created some sector-specific relief. The two governments agreed to establish an AI dialogue, with another exchange scheduled for November, alongside an AI-incident communication channel. They also endorsed a reciprocal tariff-reduction arrangement covering $30 billion of trade. State Council of China
We view these developments as tactical positives rather than a change in China’s broader macro trajectory. Improved trade communication cannot by itself repair weak household demand, property balance sheets or subdued credit appetite. Industrial growth can therefore remain respectable while becoming progressively harder to sustain.
Property Has Not Found Its Floor
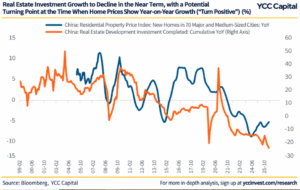
Property remains the clearest structural drag.
Cumulative real-estate development investment fell 19.9% year over year through August, deteriorating another 0.7 percentage point and reaching the weakest reading since the data series began in 1999. Investment growth has now remained negative for 49 consecutive months.
Sales offer little evidence of a durable reversal. Floor area sold fell 12.1% year over year on a cumulative basis, worsening for a fourth consecutive month. Sales value declined 13.0%. Unsold floor area, by contrast, decreased 1.1%, suggesting some inventory improvement.
Yet falling inventory is not enough when new demand remains weak.
Household borrowing makes the problem particularly visible. New medium- and long-term household loans were -RMB82.2 billion in August, RMB102.2 billion weaker than a year earlier. Cumulative January-August borrowing was only RMB18.8 billion. Both readings were extraordinarily weak relative to the history of the series. Personal mortgage funding available to property developers also remained deeply negative, declining 22.4% year over year through August.
In everyday terms, developers can discount apartments and banks can advertise mortgages, but the transaction still requires a household willing to sign a 20- or 30-year commitment. That willingness remains scarce.
One useful turning-point indicator is second-hand home prices across China’s 70 major cities. Their year-over-year decline narrowed to 5.1% in August, the best reading in roughly 30 months. First-tier cities were comparatively stronger at -2.7%, versus -4.9% in second-tier cities and -5.6% in third-tier cities.
We would treat an eventual return to positive year-over-year resale-price growth—particularly if it spreads from first-tier into second-tier cities—as an important confirmation signal. Until then, declaring a property-investment bottom looks premature.
The Consumer Is Still Missing
China’s consumption data weakened alongside the labor market. August retail sales grew only 0.4% year over year, below the 0.7% expectation and down from 0.6%. Cumulative retail growth slipped to 1.1%, while seasonally adjusted monthly sales contracted 0.13%.
The nationwide surveyed urban unemployment rate increased to 5.3%. More troubling is the age distribution. Excluding students, unemployment among workers aged 16–24 reached 18.9%, while unemployment among those aged 25–29 rose to 7.5%. The rate for workers aged 30–59 remained much lower at 3.9%.
That distinction matters for consumption. Younger workers generally have lower absolute incomes but higher marginal propensities to consume. Employment weakness concentrated among younger households can therefore have an outsized effect on discretionary spending and confidence.
Liquidity is not providing much relief either. M2 growth slowed to 7.5% in August, down 0.2 percentage point and the weakest since April 2025.
The People’s Bank of China’s September policy meeting maintained an appropriately accommodative stance and emphasized stronger countercyclical adjustment, flexible use of monetary tools and ample liquidity. China Finance Information Network Yet monetary easing faces a familiar obstacle: cheaper money cannot force households to borrow or consume when employment expectations and property confidence remain weak.
YCC Strategic View
China’s August numbers reinforce our cautious view. Manufacturing and high-tech production remain genuine sources of resilience, and policy easing can cushion the slowdown. But the economy is increasingly divided between a productive supply side and a hesitant household sector.
The central investment question is therefore not whether China can manufacture more. It clearly can. The question is whether domestic balance sheets can absorb what the economy produces while property ceases destroying household confidence.
For now, the evidence is insufficient.
We would watch three markers for a more convincing macro inflection: sustained positive year-over-year resale home prices, a meaningful recovery in household medium- and long-term borrowing, and an improvement in youth employment accompanied by stronger retail sales. Until those signals arrive together, periodic improvements in industrial data are better interpreted as resilience inside a weak domestic-demand regime than evidence of a broad economic recovery.
Source: Bloomberg, YCC Capital
Editorial Board
Ken Cao, Chief Strategist, Global Investment Strategy; Le Gao, Managing Analyst; Yui Nabeshima, Strategist; Mai Ikeda, Research Analyst.
IMPORTANT DISCLAIMER
This research report is provided for informational and educational purposes only and does not constitute an offer to sell or a solicitation of an offer to buy any securities, financial instruments, or investment products. It is not intended as investment, legal, accounting, or tax advice and should not be relied upon as such. The views, opinions, and projections expressed herein are those of YCC Capital Management and its research personnel as of the date of publication and are subject to change without notice. Past performance is not indicative of future results.
YCC Capital Management, its affiliates, principals, and employees may hold long or short positions in securities or instruments discussed in this report and may trade for their own accounts or for client accounts in a manner inconsistent with the recommendations herein. This report is based on publicly available information and data believed to be reliable, but YCC Capital makes no representation or warranty, express or implied, as to the accuracy, completeness, or timeliness of such information. Forward-looking statements involve risks and uncertainties that could cause actual results to differ materially from those projected.
Recipients of this report should conduct their own independent due diligence and consult with their own financial, legal, and tax advisors before making any investment decisions. YCC Capital accepts no liability for any loss or damage arising from the use of or reliance on this report or its contents.
This report is intended solely for the use of the intended recipient(s) and may not be reproduced or redistributed for commercial purposes without the prior written consent of YCC Capital. © 2026 YCC Capital. All rights reserved. YCC Capital’s flagship vehicle, the YCC International Value Fund, LP, maintains a concentrated global macro value strategy with a focus on capital-flow-driven mispricings and asymmetric hedging opportunities. The Fund is registered in the State of Delaware, U.S and structured as a 506(c) fund. Performance data, where referenced, has been verified by independent third parties including NAV Consulting; however, individual investor results may vary.
Contact Us
For research inquiries, contact ir@yccinvest.com. Sign up for YCC Capital’s free daily market insight at yccinvest.com.
YCC Capital Research | Sign up for free daily market insight at www.yccinvest.com
For more related research:
Oil’s Vanishing Safety Margin: Why Brent’s Floor Is Higher Than It Looks
Oil After the Shock: Why Tight Supply Is Likely to Keep Inflation Elevated Through Year-End