YCC CAPITAL
Commodity & Energy Strategy
September 2, 2026
The oil market is increasingly being priced not around abundance, but around the shrinking margin for error. That distinction matters. A market can absorb bad news when inventories are comfortable, strategic reserves are deep, and spare capacity can reach consumers quickly. Today, all three cushions look thinner than they did at the start of the year.
Our central view is that crude oil remains one of the most important variables in global asset pricing through the remainder of 2026. Even as demand softens, supply security has deteriorated enough that Brent is unlikely to return sustainably to its pre-conflict trading regime. The balance has shifted from “How much oil does the world need?” toward a more uncomfortable question: “How much disruption can the system still absorb?”
Source: Bloomberg, YCC Capital
Copper Is Still Signaling Resilience in the U.S. Cycle
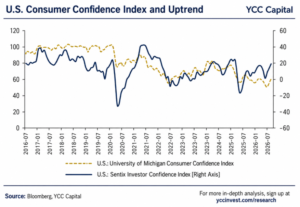
Before turning to oil, copper continues to offer a useful cross-check on the broader macro picture. Historically, copper prices have exhibited a strong negative relationship with the U.S. inventory-to-sales ratio. When inventories are lean relative to sales, economic activity is usually healthier and industrial demand is firmer. Copper has also tended to move in the same direction as global manufacturing PMI.
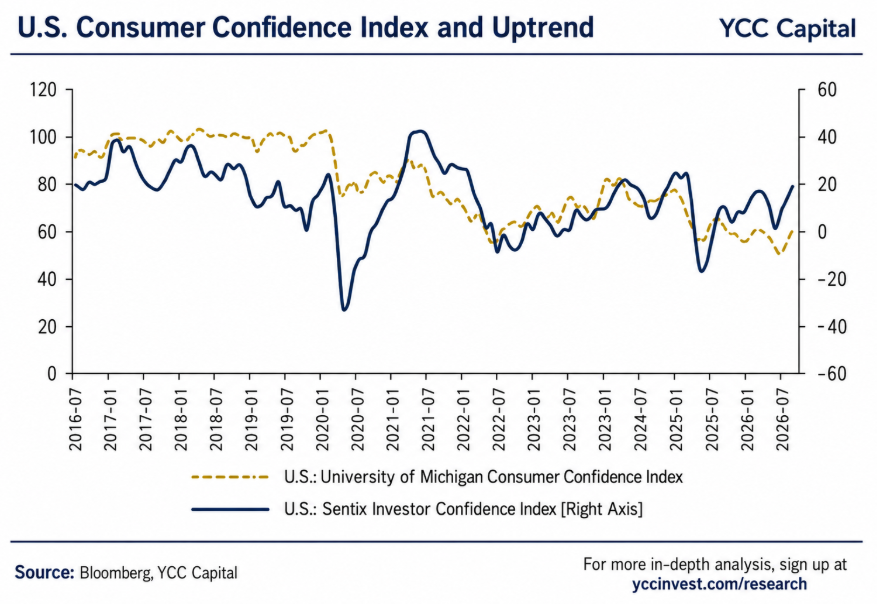
Recent U.S. consumer-confidence readings have remained comparatively resilient, reinforcing our view that the probability of a systematic U.S. downturn remains limited. We remain cautiously constructive on the U.S. economy. Strategic-energy investment, AI-related infrastructure spending, grid upgrades and the continued build-out of electrification demand all create a more durable industrial demand backdrop than headline recession narratives suggest.
For copper, that means a deep and sustained correction remains difficult to justify without a material deterioration in U.S. activity or a broader collapse in global manufacturing. Policy developments around U.S. copper tariffs remain important, as does the pace of deliveries into LME warehouses, but the larger message is that the demand base has not disappeared.
Oil, however, presents a more acute challenge because the supply cushion is now considerably weaker.
Source: Bloomberg, YCC Capital
From $68 to $90: The Oil Market’s 2026 V-Shaped Shock
Brent crude experienced an unusually sharp V-shaped move between June and August 2026. In June, optimism around a temporary U.S.-Iran understanding encouraged traders to price in easing geopolitical risk. Expectations that traffic through the Strait of Hormuz would normalize helped push Brent back toward approximately $68 per barrel.
That optimism proved short-lived.
By July, the political foundation of the temporary understanding had weakened. Renewed U.S. maritime restrictions on Iran reversed the market’s assumptions, and Brent surged back toward $90 per barrel.
The price action was dramatic, but the more important development happened underneath the screen: inventories were being drained.
Since the outbreak of the U.S.-Iran confrontation, observed global oil inventories have declined by roughly 410 million barrels. In July 2026 alone, inventories fell by approximately 69 million barrels. By the end of July, observed global oil inventories had dropped below 7.9 billion barrels, the lowest level since April 2025.
This is the equivalent of driving a long mountain road after the fuel-warning light has already come on. The car may still be moving normally, but the room for another wrong turn is much smaller.
OECD inventories are now close to levels that materially reduce the market’s operating buffer. That is why relatively small geopolitical developments can create disproportionately large price reactions.
Source: Bloomberg, YCC Capital
Hormuz Remains the Market’s Narrowest Bottleneck
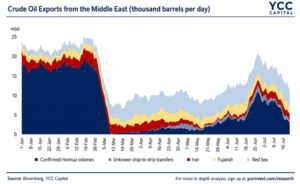
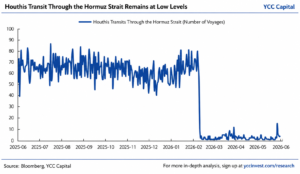
The Strait of Hormuz is central to the current supply risk because more than 30% of seaborne crude oil trade passes through the route under normal conditions. Persistent U.S.-Iran confrontation has sharply reduced effective transit capacity.
Before and around the beginning of the conflict in early March, daily ship transits through Hormuz fell from roughly 120 vessels per day to fewer than 10. Conditions briefly improved in late June, when daily tanker transits reached approximately 43 vessels, but the recovery did not hold.
From July 10 onward, tanker traffic again remained below 10 vessels per day. During early August, average daily tanker transit fell to only about 1.25 vessels per day.
That number is the core of the current risk premium.
The problem is not simply whether Middle Eastern producers possess oil underground. It is whether barrels can physically reach the market. Spare capacity trapped behind a geopolitical bottleneck is not economically equivalent to freely exportable spare capacity.
Source: Bloomberg, YCC Capital
OPEC Supply Has Recovered, but Not Enough
OPEC crude production has rebounded from the post-conflict trough, but output remains materially below pre-confrontation levels.
In July 2026, OPEC crude production reached approximately 23.63 million barrels per day, up by 4.66 million barrels per day from the 18.97 million barrels per day recorded in May. Yet production remained almost 5 million barrels per day below the roughly 28.5 million barrels per day produced before the U.S.-Iran conflict.
This is an important distinction for investors. Headlines describing “OPEC production increases” may sound bearish for crude, but the level matters more than the direction. Recovering from a severe disruption does not automatically mean that the market has returned to normal.
Moreover, much of the Middle East’s nominal spare capacity is concentrated around the Persian Gulf, precisely where geopolitical constraints are most acute. Internal OPEC+ differences may further complicate the process of turning theoretical capacity into reliable physical exports.
The International Energy Agency estimated global oil supply at roughly 101.5 million barrels per day in July, up about 2.4 million barrels per day month over month, with much of the incremental supply coming from non-OPEC production, including shale and deepwater projects in the Americas. Even so, supply remained approximately 8.3 million barrels per day below year-earlier levels.
The estimated third-quarter market deficit widened to roughly 1.8 million barrels per day, compared with an earlier estimate near 800,000 barrels per day.
Source: Bloomberg, YCC Capital
America’s Strategic Cushion Has Been Drawn Down Aggressively
The United States has acted as a critical stabilizer during the disruption, but that role has come at a cost.
On March 11, 2026, President Trump authorized the release of approximately 172 million barrels of oil in response to supply interruptions associated with the conflict and restricted tanker flows through Hormuz.
The subsequent drawdown was substantial. U.S. Strategic Petroleum Reserve inventories declined from roughly 413 million barrels at their April high to approximately 290 million barrels by August 21, the lowest level since 1982.
This does not imply that the United States lacks energy security. The U.S. remains structurally better positioned than many large import-dependent economies because of its substantial domestic production base. We remain cautiously optimistic about the resilience and responsiveness of the U.S. energy system. But the tactical point is unavoidable: the emergency buffer available to suppress the next price spike is now smaller.
Commercial and strategic inventories combined tell the same story. By mid-August, U.S. commercial crude, petroleum-product and reserve inventories totaled approximately 1.539 billion barrels, down around 10% from 1.716 billion barrels in mid-January.
Historically, lower aggregate U.S. petroleum inventories have tended to coincide with higher crude prices. That relationship is becoming increasingly relevant again.
Source: Bloomberg, YCC Capital
Demand Is Weakening, but Demand Destruction Is Not Yet Enough
The bearish side of the oil argument deserves equal weight.
High fuel prices and restricted Hormuz traffic are suppressing consumption. Global oil demand in 2026 is now expected to decline, a meaningful change from the post-pandemic trend.
The August outlook put 2026 global oil demand at approximately 103.29 million barrels per day, implying a year-over-year decline of around 1.56 million barrels per day. That estimate was revised down by approximately 510,000 barrels per day from the prior month and would represent the first annual decline in global oil demand since the extraordinary dislocation of 2020.
Yet weakening demand does not automatically create a bearish oil market when supply is falling faster and inventories are already depleted.
This is the tension investors must respect. Oil is simultaneously experiencing demand destruction and a scarcity premium. One force caps the upside; the other supports the downside.
That combination is more consistent with a volatile elevated range than with a clean directional collapse.
Source: Bloomberg, YCC Capital
Technical Structure Still Argues Against a Deep Second-Half Decline
The longer-term technical structure has also been supportive. In late February 2026, Brent’s monthly MACD began forming a bullish crossover.
Comparable monthly MACD signals appeared around the 2002–2003, 2007–2008, 2009–2010, 2015–2016, and 2020–2022 periods. Historically, these episodes were often associated with strengthening medium-term crude-price momentum.
In early 2026, the technical signal preceded the fundamental shock. Within weeks, the U.S.-Iran conflict sharply reduced Middle Eastern exports and crude prices nearly doubled over a short period.
Technical indicators should never replace fundamental analysis, but they can sometimes reveal that positioning, liquidity and underlying market structure are shifting before the catalyst becomes obvious.
Source: Bloomberg, YCC Capital
YCC Strategic View: Brent’s New Center of Gravity
Our base case is that Brent’s trading center remains above its pre-conflict level through year-end.
If the U.S.-Iran standoff persists and Hormuz remains partially constrained, we believe Brent can continue to oscillate around an $80–$90 per barrel central range. If disruptions around both the Strait of Hormuz and Bab el-Mandeb last longer than expected, a renewed move to fresh highs cannot be ruled out.
A credible diplomatic reopening would materially reduce the geopolitical premium and could send Brent back toward approximately $70 per barrel. Even in that scenario, however, depleted global inventories and a historically thin U.S. strategic reserve are likely to limit the depth and duration of the decline.
For investors, oil should therefore be treated not merely as another commodity exposure, but as a macro transmission mechanism. Elevated crude prices affect inflation expectations, real household income, transportation costs, industrial margins, bond yields and central-bank flexibility. When oil becomes unstable, it leaks into almost every corner of a portfolio.
The market is no longer operating with a thick shock absorber. Until inventories rebuild, shipping normalizes and spare capacity becomes genuinely exportable, crude’s downside is likely to remain better protected than many traditional demand models imply.
Editorial Board
Ken Cao, Chief Strategist, Global Investment Strategy
Le Gao, Managing Analyst
Yui Nabeshima, Strategist
Mai Ikeda, Research Analyst
IMPORTANT DISCLAIMER
This research report is provided for informational and educational purposes only and does not constitute an offer to sell or a solicitation of an offer to buy any securities, financial instruments, or investment products. It is not intended as investment, legal, accounting, or tax advice and should not be relied upon as such. The views, opinions, and projections expressed herein are those of YCC Capital Management and its research personnel as of the date of publication and are subject to change without notice. Past performance is not indicative of future results.
YCC Capital Management, its affiliates, principals, and employees may hold long or short positions in securities or instruments discussed in this report and may trade for their own accounts or for client accounts in a manner inconsistent with the recommendations herein. This report is based on publicly available information and data believed to be reliable, but YCC Capital makes no representation or warranty, express or implied, as to the accuracy, completeness, or timeliness of such information. Forward-looking statements involve risks and uncertainties that could cause actual results to differ materially from those projected.
Recipients of this report should conduct their own independent due diligence and consult with their own financial, legal, and tax advisors before making any investment decisions. YCC Capital accepts no liability for any loss or damage arising from the use of or reliance on this report or its contents.
This report is intended solely for the use of the intended recipient(s) and may not be reproduced or redistributed for commercial purposes without the prior written consent of YCC Capital. © 2026 YCC Capital. All rights reserved. YCC Capital’s flagship vehicle, the YCC International Value Fund, LP, maintains a concentrated global macro value strategy with a focus on capital-flow-driven mispricings and asymmetric hedging opportunities. The Fund is registered in the State of Delaware, U.S and structured as a 506(c) fund. Performance data, where referenced, has been verified by independent third parties including NAV Consulting; however, individual investor results may vary.
Contact Us
For research inquiries, contact ir@yccinvest.com.
Sign up for free daily market insight at yccinvest.com.
YCC Capital Research | Sign up for free daily market insight at www.yccinvest.com
For more related research:
Oil After the Shock: Why Tight Supply Is Likely to Keep Inflation Elevated Through Year-End
The Bank of Japan Just Sent a Warning to the Entire Financial World
China’s Recovery Is Losing Altitude: Exports Mask a Deepening Domestic Slowdown
The AI Infrastructure Boom: Can Trillions in Investment Become Sustainable Economic Value?
America’s Expensive Rebuild AI, Strategic Manufacturing and the Price of Economic Transformation