YCC CAPITAL
Global Strategy
Date: July 14, 2026
Executive Summary
Every market cycle eventually tempts investors into believing that “this time is different.” During technology booms, it becomes easy to assume extraordinary returns are permanent. During prolonged downturns, investors often conclude that equities have permanently lost their appeal. History suggests both conclusions are usually wrong.
One of the most useful questions an investor can ask is not whether markets will rise next month or next quarter, but rather what constitutes a reasonable long-term return from owning productive businesses. That question lies at the heart of portfolio construction, pension management, wealth preservation, and capital allocation.
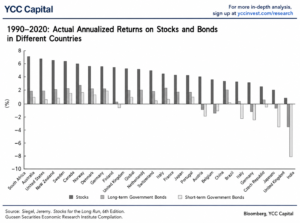
Looking across more than a century of global market history, one conclusion emerges with remarkable consistency: equities remain the highest-returning major asset class over long investment horizons. Despite wars, depressions, inflationary shocks, financial crises and political upheaval, diversified stock ownership has historically delivered nominal annualized returns of roughly 8%–10%, comfortably exceeding bonds, real estate, commodities, precious metals and cash.
This observation is not simply a statistical curiosity. It reflects a fundamental truth about capitalism itself. Businesses innovate, productivity improves, earnings compound and dividends accumulate. Investors who remain patient participate directly in that process.
For long-term investors, patience is not merely a virtue—it is an economic asset.
At YCC Capital, we believe today’s market environment makes revisiting these long-run relationships particularly valuable. The dramatic divergence between technology leadership and traditional sectors has reignited debates about fair valuation, sustainable returns and future market leadership. Understanding where current returns stand relative to historical norms provides an essential framework for evaluating opportunities across global markets.
Several broad conclusions emerge from our analysis.
First, global equity markets have historically generated nominal annualized returns close to 8–10%, with U.S. equities delivering approximately 9–10% over the past century.
Second, long-term stock returns ultimately reflect economic fundamentals rather than investor enthusiasm. At the macro level, countries experiencing faster nominal GDP growth generally produce stronger long-run equity returns. At the company level, corporate earnings growth and dividend distributions explain the overwhelming majority of long-term shareholder wealth creation.
Third, valuation expansion—or what investors often describe as multiple expansion—has historically contributed surprisingly little over very long horizons. Market optimism fluctuates dramatically from cycle to cycle, but corporate cash generation ultimately determines investment outcomes.
Fourth, while U.S. equities have recently generated returns substantially above their historical averages, broad Chinese equity benchmarks have produced returns closer to—or even below—their long-term norms. Within China, however, significant dispersion has emerged across sectors, with technology outperforming while traditional industries including property, financials and consumer staples continue to lag historical performance.
Rather than signaling the end of equity investing, these divergences illustrate the normal evolution of market cycles.
The Century-Long Evidence: Why Equities Continue to Outperform
Imagine two families beginning their investment journeys generations ago.
One purchases government bonds and safely rolls them over every decade.
The other acquires ownership stakes in businesses—factories at first, later industrial firms, consumer brands, software companies and artificial intelligence leaders—allowing profits to compound through reinvestment and dividends.
Both experience recessions, inflation and geopolitical shocks. Yet after several decades, the second family’s wealth becomes exponentially larger.
That simple illustration captures one of the most consistent findings in financial history.
Equities Have Been the World’s Best Long-Term Investment
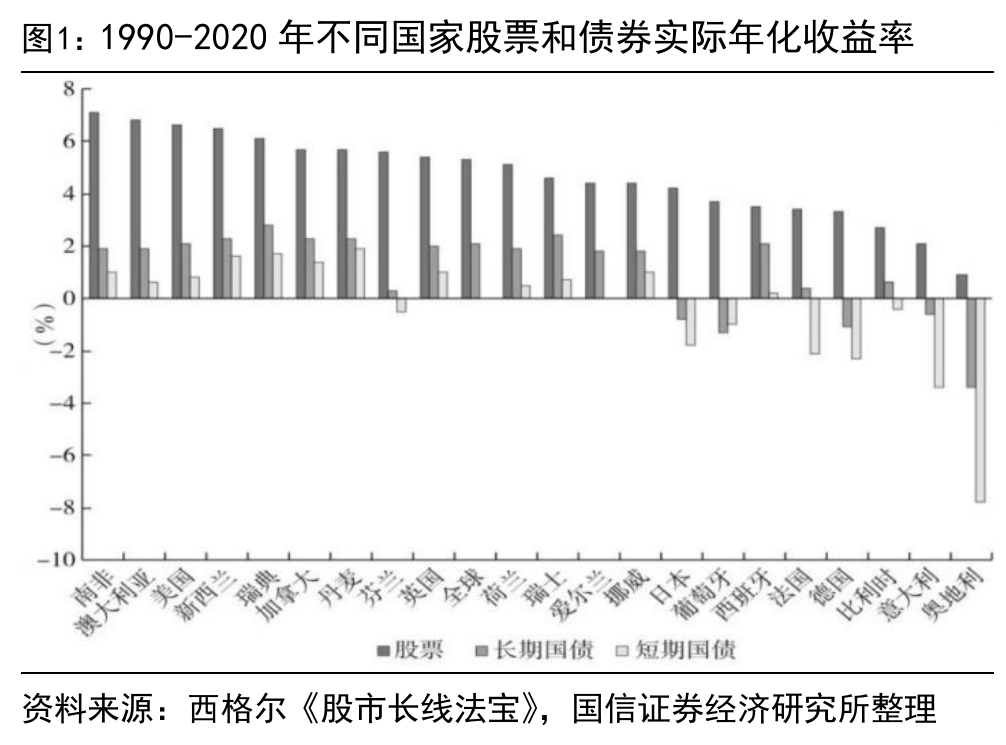
Historical evidence spanning more than one hundred years demonstrates remarkable consistency across developed markets.
Research summarized by Jeremy Siegel and corroborated by subsequent academic literature shows that between 1900 and 2020 global equities generated approximately 5.3% real annual returns after inflation. Once inflation is incorporated, nominal returns approach 9% annually, while U.S. equities have historically exceeded 9.5% nominal annual returns.
Although annual market performance fluctuates dramatically, extending the investment horizon progressively reduces the influence of temporary market dislocations.
Looking at more recent decades tells a similar story.
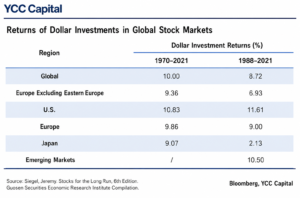
Between 1988 and 2021:
- Global equities produced approximately 8.7% annualized U.S. dollar returns.
- Emerging markets generated roughly 10.5%.
- U.S. equities delivered approximately 11.6%.
Different regions experience different cycles, yet the long-run equilibrium remains remarkably stable.
For investors with horizons extending twenty years or longer, annualized equity returns have historically converged toward approximately 8–10%.
This consistency reflects a fundamental economic reality.
Unlike bonds, whose future cash flows are largely fixed, businesses possess the ability to expand production, improve productivity, develop new technologies, enter new markets and raise prices alongside inflation. Equity ownership therefore represents participation in an expanding economic system rather than ownership of a fixed contractual claim.
Stocks Consistently Outperform Other Major Asset Classes
Historical asset allocation data reinforces the same conclusion.
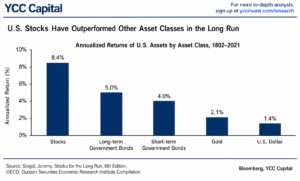
Across more than two centuries of U.S. financial history, equities have significantly outperformed nearly every major alternative investment.
Average nominal annual returns approximately equal:
- U.S. equities: 8.4%
- Long-term government bonds: 5.0%
- Treasury bills: 4.0%
- Gold: 2.1%
- U.S. dollar cash purchasing power: 1.4%
While the numerical differences appear modest on an annual basis, compounding transforms these gaps into extraordinary wealth differentials.
A single dollar invested in U.S. equities at the beginning of the nineteenth century would ultimately have appreciated into tens of millions of dollars when dividends are continually reinvested. The same dollar invested in gold or cash would have produced only a tiny fraction of that wealth.
Compounding is often called the eighth wonder of the world because it rewards consistency rather than brilliance.
Investors rarely appreciate its full power because it unfolds gradually before becoming exponential.
China Shows Similar Asset Allocation Patterns—With Important Caveats
China’s modern financial history is considerably shorter, yet broad asset allocation trends display similar characteristics.
Between 2005 and 2025:
- Wind All A shares delivered approximately 10.6% annualized total returns.
- CSI 300 Total Return Index generated roughly 10.0%.
- Residential real estate, including rental income, returned approximately 8.3%.
- Broad commodities produced roughly 4.8%.
- Government bonds generated approximately 4.3%.
Equities therefore remained the strongest-performing major domestic asset class over the period.
However, YCC Capital believes investors should interpret these figures cautiously.
Unlike the United States, China’s future economic trajectory faces substantially greater structural uncertainty. Demographic deterioration, declining productivity growth, elevated local government debt, prolonged weakness in property markets and persistent geopolitical tensions all suggest future returns may prove materially lower than those achieved during China’s rapid industrialization phase.
Consequently, while historical Chinese equity returns resemble those observed elsewhere, extrapolating past performance into future decades deserves considerably greater caution than comparable assumptions regarding developed markets.
What Actually Drives Stock Market Returns: Fundamentals Always Win
Investors often describe markets as emotional voting machines in the short run and rational weighing machines over the long run. That observation, originally attributed to Benjamin Graham, remains one of the most useful frameworks for understanding equity returns.
Prices may swing wildly around news headlines, geopolitical shocks or changes in investor sentiment. Yet over decades, stock prices ultimately converge toward one destination: the earnings power of the underlying businesses.
A century of market history reinforces this lesson. While speculative enthusiasm can temporarily elevate valuations far beyond fundamentals—or drive them well below intrinsic value—long-run investment performance is overwhelmingly determined by economic growth, corporate profitability and the steady accumulation of dividends.
At YCC Capital, we view this distinction as essential. Investors frequently devote enormous effort to forecasting next quarter’s market movements while devoting comparatively little attention to the structural drivers that ultimately create wealth. History suggests the opposite approach has produced more consistent results.
Economic Growth and Equity Returns Move Together
The relationship between economic growth and equity performance is neither perfect nor immediate. Markets routinely anticipate future developments, and valuations can remain detached from economic reality for years.
Nevertheless, when viewed across multiple decades, countries experiencing stronger nominal economic growth have generally produced stronger long-term equity returns.
Historical comparisons across major economies illustrate this relationship clearly.
Mainland China and Taiwan both experienced nominal GDP growth approaching 9–10% during their periods of rapid industrialization, and their major equity indices generated annualized returns close to 10%.
South Korea followed a similar trajectory, pairing double-digit economic expansion during its development phase with equity returns approaching 9%.
In contrast, mature economies such as Japan, France and the United Kingdom, where nominal GDP growth averaged closer to 4–5%, produced correspondingly lower long-term equity returns in the mid-single digits.
The United States occupies an interesting middle ground. Since World War II, nominal GDP growth has averaged approximately 6%, while broad equity markets have compounded near 8% annually. The difference reflects America’s exceptional corporate profitability, deep capital markets, innovation ecosystem and shareholder-friendly culture.
This relationship is not mechanical, nor should investors assume that every fast-growing economy automatically generates outstanding stock returns. Corporate governance, legal protections, capital allocation efficiency and financial market development all matter enormously.
China offers a useful illustration of this distinction.
Rapid GDP growth over the past three decades created enormous wealth, yet a significant portion of that expansion accrued to state-owned enterprises, local governments and property development rather than public shareholders. As China’s structural growth slows and demographic headwinds intensify, investors should expect equity returns to become increasingly dependent on company-level profitability rather than broad macroeconomic expansion.
By contrast, the United States continues to benefit from a more dynamic innovation cycle. Leadership in artificial intelligence, cloud computing, biotechnology and advanced manufacturing provides a foundation for sustained earnings growth even as headline GDP growth moderates.
Corporate Earnings Are the Primary Source of Long-Term Wealth Creation
While macroeconomic growth establishes the broad environment, individual shareholder returns are ultimately generated at the company level.
Every dollar of long-term equity appreciation can generally be traced back to one of three sources:
- Growth in corporate earnings.
- Cash returned through dividends.
- Changes in valuation multiples.
Historical evidence overwhelmingly suggests the first two dominate over long investment horizons.
The U.S. Experience
John Bogle’s decomposition of long-term U.S. equity returns provides perhaps the clearest framework.
Since 1900, annual equity returns have averaged approximately 9.6%.
Those returns break down into:
- Earnings growth: roughly 5.0%
- Dividend income: roughly 4.5%
- Valuation expansion (speculation): approximately 0.1%
This finding surprises many investors.
The popular narrative often credits spectacular bull markets to expanding price-to-earnings multiples. While valuation changes can create powerful gains during individual cycles, their cumulative contribution across more than a century has been almost negligible.
Speculation creates volatility.
Business fundamentals create wealth.
Looking at the modern era tells the same story.
Between 2000 and 2025, the S&P 500 Total Return Index generated cumulative returns exceeding 660%.
More than 650 percentage points of those gains came from a combination of earnings expansion and reinvested dividends, while valuation changes contributed comparatively little over the full period.
The implication is profound.
Investors seeking sustainable long-term returns should spend less time predicting market psychology and more time evaluating the durability of corporate earnings.
The Same Principle Applies to Chinese Equities
Although China’s capital markets are considerably younger, the underlying mechanism remains remarkably similar.
Between 2006 and 2025, the CSI 300 Total Return Index produced annualized returns of approximately 10.5%.
That performance consisted of:
- Earnings growth: 8.5%
- Dividend income: 2.1%
- Valuation changes: approximately –0.1%
Once again, nearly all long-term shareholder wealth originated from business performance rather than speculative enthusiasm.
However, there is one important distinction.
Chinese corporate earnings have historically exhibited significantly greater volatility than those of mature developed markets.
Several structural factors explain this pattern.
The Chinese equity market remains heavily influenced by policy intervention, state-owned enterprises, regulatory campaigns and periodic shifts in government priorities. Capital allocation is frequently shaped by political objectives alongside commercial considerations, creating larger swings in profitability than investors typically observe in developed markets.
The regulatory crackdown on internet platforms, the prolonged correction in residential property and recurring interventions across education, healthcare and financial services illustrate how policy uncertainty can alter earnings trajectories with little warning.
Consequently, while long-term returns still originate from earnings, forecasting those earnings in China remains materially more difficult than in markets characterized by stronger institutional stability.
This distinction reinforces one of YCC Capital’s core strategic views.
Long-term investing is not merely about identifying growing economies. It is about identifying systems where profitable businesses can compound capital with predictable rules, stable governance and durable shareholder rights.
In that respect, the United States continues to enjoy a meaningful structural advantage.
Return on Equity Provides an Important Reality Check
One useful way to evaluate whether market returns remain fundamentally justified is to compare long-run investment performance with corporate return on equity (ROE).
Across both developed and emerging markets, equity returns generally track the profitability of listed companies over extended periods.
Historical evidence illustrates this relationship clearly.
The S&P 500 has generated annualized total returns close to 10–11% since 1960, while average corporate ROE has remained near 13%.
Similarly, the CSI 300 has delivered approximately 10% annualized returns since its inception, broadly consistent with average corporate ROE around 12–13%.
Technology-heavy indices exhibit similar relationships over long horizons, although shorter histories naturally produce greater volatility.
This comparison serves as an important warning against unrealistic expectations.
Whenever market returns significantly exceed sustainable corporate profitability for extended periods, investors should recognize that future returns are increasingly dependent upon continued valuation expansion rather than improving fundamentals.
History shows such periods rarely persist indefinitely.
Patience Is Still the Most Underappreciated Competitive Advantage
Every generation believes it faces unprecedented uncertainty.
The Great Depression, the inflationary crises of the 1970s, the dot-com collapse, the Global Financial Crisis and the COVID pandemic each appeared uniquely catastrophic while unfolding.
Yet despite these extraordinary disruptions, diversified ownership of productive businesses continued generating attractive long-term returns.
The lesson is not that markets never decline—they frequently do.
Rather, it is that time consistently rewards businesses capable of expanding earnings and reinvesting capital.
For long-term investors, volatility should therefore be viewed less as evidence that markets are broken and more as the admission price required to earn superior long-run returns.
The greatest risk has rarely been temporary market declines.
It has been abandoning compounding before it has had sufficient time to work.
Where Today’s Markets Stand: Measuring Current Returns Against History
One of the greatest mistakes investors make is confusing recent performance with long-term expectations.
A decade of exceptional gains often convinces investors that elevated returns have become the new normal. Conversely, prolonged underperformance can lead many to abandon fundamentally sound asset classes just as long-term opportunities begin to improve.
History argues for neither complacency nor despair.
Instead, investors should continuously compare current market returns against their long-run historical equilibrium. Doing so provides a useful framework for assessing whether optimism or pessimism has become excessive.
At YCC Capital, we believe this historical benchmarking exercise is particularly relevant today, as the U.S. equity market continues to command premium valuations while China’s equity market remains trapped between cyclical stabilization and structural economic headwinds.
U.S. Equities Have Delivered Exceptional Returns—Perhaps Too Exceptional
Since the aftermath of the Global Financial Crisis, the United States has experienced one of the strongest extended bull markets in modern financial history.
From 2009 through June 2026, the S&P 500 has generated annualized returns approaching 14.6%, substantially exceeding its historical averages.
For comparison:
| Period | Annualized Return |
|---|---|
| Since 1960 | ~10.7% |
| Since 1982 | ~12.0% |
| 1982–2000 Bull Market | ~16.5% |
| 2009–2026 | ~14.6% |
Today’s performance therefore sits much closer to one of history’s greatest secular bull markets than to long-run averages.
Importantly, this does not imply that U.S. equities are destined for an imminent collapse.
Rather, it suggests investors should moderate forward return expectations.
The extraordinary gains of the past fifteen years were supported by an unusual combination of factors:
- exceptionally low interest rates,
- expanding profit margins,
- rapid technological innovation,
- globalization,
- aggressive corporate share buybacks,
- and, more recently, the emergence of artificial intelligence as a transformational investment theme.
Many of these forces remain intact, particularly America’s leadership in AI, semiconductors, software and advanced manufacturing. Nevertheless, the starting point for future returns is now materially higher than it was in 2009.
Historically, when valuations begin from elevated levels, subsequent long-term returns tend to normalize rather than accelerate.
Our interpretation is therefore constructive but disciplined.
YCC Capital remains cautiously optimistic on U.S. equities over the long term, not because valuations are inexpensive, but because the United States continues to possess structural advantages that few economies can replicate. Flexible labor markets, deep capital markets, world-leading research institutions and an unparalleled innovation ecosystem continue to support corporate profitability even as the broader economy matures.
China’s Broad Equity Market Tells a Very Different Story
The picture becomes considerably more complex when examining China’s equity market.
Measured across a complete bull-and-bear cycle beginning in 2019, the CSI 300 has produced annualized returns of roughly 9.7%, modestly below its long-term average of approximately 10% and also below the average return on equity generated by listed companies over the same period.
At first glance, this might suggest valuations have become relatively attractive.
However, a closer examination reveals that the apparent discount reflects more than cyclical weakness. It also reflects mounting structural challenges facing China’s economy.
Unlike previous decades, today’s China confronts a markedly different macroeconomic backdrop.
The country’s property sector—which for years served as the principal engine of household wealth creation and local government financing—continues to undergo a prolonged adjustment. Demographic aging is reducing labor force growth, while youth unemployment and subdued private-sector confidence continue to weigh on domestic demand. Persistent deflationary pressures, elevated debt burdens and a more interventionist policy environment further complicate the outlook.
Taken together, these factors suggest that historical return benchmarks may overstate what investors should reasonably expect over the coming decade.
For this reason, YCC Capital believes investors should be cautious about assuming that mean reversion alone will restore China’s previous equity leadership.
Lower valuations do not automatically imply higher future returns if the underlying earnings engine is simultaneously slowing.
Growth Stocks Have Led the Recovery
Although broad Chinese indices have struggled, leadership within the market has become increasingly concentrated.
Technology-oriented indices have substantially outperformed traditional sectors.
Since 2019:
- ChiNext Index annualized returns have reached approximately 18.4%, well above both its historical average and corporate earnings growth.
Similarly:
- STAR 50 Index has generated annualized returns near 11.6%, also exceeding both average ROE and profit growth over the same period.
This divergence reflects renewed investor enthusiasm surrounding advanced manufacturing, semiconductors, artificial intelligence infrastructure and selected high-technology industries.
Yet investors should recognize that recent outperformance has been driven not only by improving fundamentals but also by expanding market expectations.
Whenever prices rise significantly faster than earnings, valuation risk naturally increases.
This does not imply these sectors lack long-term potential.
Rather, it emphasizes the importance of distinguishing between excellent companies and excellent investments. Even exceptional businesses can generate disappointing returns if purchased at excessively optimistic valuations.
Traditional Value Sectors Continue to Lag
The opposite dynamic can be observed across much of China’s traditional economy.
Historical comparisons show that several sectors continue to generate returns below their long-term averages while simultaneously underperforming during the current year.
Among the weakest areas are:
- Real estate
- Non-bank financial institutions
- Pharmaceuticals
- Food and beverage
- Retail and commercial services
Some of these industries undoubtedly reflect cyclical weakness.
Others, however, face more persistent structural challenges.
The property sector, in particular, appears unlikely to regain the dominant economic role it occupied during the previous two decades. Regulatory tightening, demographic pressures and excess housing supply suggest that future growth will almost certainly be slower than in the past.
Likewise, portions of the financial sector remain constrained by declining credit demand, pressure on net interest margins and rising concerns over local government financing vehicles.
These industries may experience periodic rallies, but investors should avoid assuming that depressed valuations alone guarantee superior long-term returns.
Structural change often redefines what constitutes “cheap.”
YCC Capital Strategic View
History teaches a remarkably consistent lesson.
Markets change.
Technologies evolve.
Economic leadership shifts.
Yet the underlying drivers of long-term equity returns remain surprisingly stable.
Companies that consistently grow earnings, generate free cash flow and allocate capital intelligently continue creating shareholder wealth regardless of changing headlines.
From this perspective, the most valuable insight from more than a century of market history is not that equities always rise, but that productive businesses continue compounding value over time.
Looking ahead, YCC Capital expects the global investment landscape to become increasingly differentiated.
The United States remains the strongest structural equity market. Although future returns are likely to moderate from the extraordinary gains experienced since 2009, America’s leadership in artificial intelligence, cloud computing, automation, biotechnology and next-generation industrial technologies should continue supporting superior corporate profitability. Elevated valuations warrant selectivity rather than wholesale pessimism.
Japan presents a different opportunity. Corporate governance reforms, improving capital efficiency and a gradual normalization of domestic inflation continue to strengthen the long-term investment case. While short-term economic fluctuations are inevitable, we believe Japan’s current challenges are cyclical rather than indicative of permanent structural decline. The country’s improving return on equity and increasing shareholder focus remain encouraging developments.
Europe continues to offer selective opportunities but faces slower structural growth, leaving earnings expansion more dependent on sector selection than broad market exposure.
China, by contrast, requires greater discrimination than at any point in the past decade. The era during which rapid GDP growth alone lifted broad equity indices appears to be ending. Structural headwinds—including demographics, property market adjustment, elevated debt and a less predictable regulatory environment—suggest that future returns will increasingly depend on identifying globally competitive companies rather than relying on broad index appreciation.
For long-term investors, the message is ultimately reassuring.
Expected returns should always be grounded in history, but portfolios should always be built for the future.
The discipline to distinguish temporary market excitement from durable economic value remains one of the most enduring competitive advantages available to investors. That discipline—rather than attempts to forecast every market fluctuation—has historically proven to be the foundation of successful long-term wealth creation.
Editorial Board
Ken Cao
Chief Strategist, Global Investment Strategy
Le Gao
Managing Analyst
Yui Nabeshima
Strategist
Mai Ikeda
Research Analyst
IMPORTANT DISCLAIMER
This research report is provided for informational and educational purposes only and does not constitute an offer to sell or a solicitation of an offer to buy any securities, financial instruments, or investment products. It is not intended as investment, legal, accounting, or tax advice and should not be relied upon as such. The views, opinions, forecasts, and projections expressed herein are those of YCC Capital Management and its research personnel as of the date of publication and are subject to change without prior notice. Past performance is not indicative of future results, and no representation is made that any investment strategy will achieve its objectives.
This report has been prepared using publicly available information and market data believed to be reliable, including data obtained from Bloomberg and other reputable sources. However, YCC Capital Management makes no representation or warranty, express or implied, regarding the accuracy, completeness, reliability, or timeliness of such information. Market conditions evolve continuously, and factual circumstances may change after publication.
Any forward-looking statements contained in this report involve known and unknown risks, uncertainties, assumptions, and other factors that could cause actual economic conditions, market developments, or investment outcomes to differ materially from those expressed or implied. Readers should not place undue reliance on such forward-looking statements.
YCC Capital Management, its affiliates, principals, employees, and investment professionals may, from time to time, hold long or short positions in securities, currencies, commodities, derivatives, or other financial instruments discussed in this report. Such positions may be established, modified, or liquidated without prior notice and may differ from the views expressed herein. The firm may also provide advisory or investment management services to clients whose investment strategies are inconsistent with opinions presented in this publication.
Nothing contained in this report should be construed as personalized investment advice or as a recommendation regarding the suitability of any investment strategy for any particular investor. Investment decisions should always be made based on an investor’s own financial circumstances, objectives, risk tolerance, and independent analysis. Readers are strongly encouraged to consult their financial, legal, accounting, and tax advisors before making any investment decisions.
Neither YCC Capital Management nor any of its affiliates, officers, employees, or representatives accepts liability for any direct or consequential loss arising from the use of, or reliance upon, the information contained in this report.
This publication may not be reproduced, distributed, transmitted, quoted, or otherwise disseminated for commercial purposes without the prior written consent of YCC Capital Management.
© 2026 YCC Capital. All rights reserved.
YCC Capital’s flagship vehicle, the YCC International Value Fund, LP, maintains a concentrated global macro value strategy focused on capital-flow-driven market dislocations, asymmetric investment opportunities, and disciplined risk management. The Fund is registered in the State of Delaware, United States, and is structured as a Rule 506(c) private investment vehicle. Where referenced, performance information has been independently verified by third-party fund administrators, including NAV Consulting; however, individual investor results may differ depending on subscription timing, fees, and capital activity.
Contact Us
YCC Capital Management
Investor Relations
Email: ir@yccinvest.com
For complimentary daily macro research, investment insights, and market commentary, subscribe to our free newsletter at:
YCC Capital Research | Sign up for free daily market insight at www.yccinvest.com
For more related research:
The AI Gold Rush Is Far From Over—But the Margin for Error Is Shrinking
Trump’s Political Playbook: Winning Abroad to Stabilize at Home
The Energy Shock Is Fading—Now Markets Must Price the Next Liquidity Cycle