
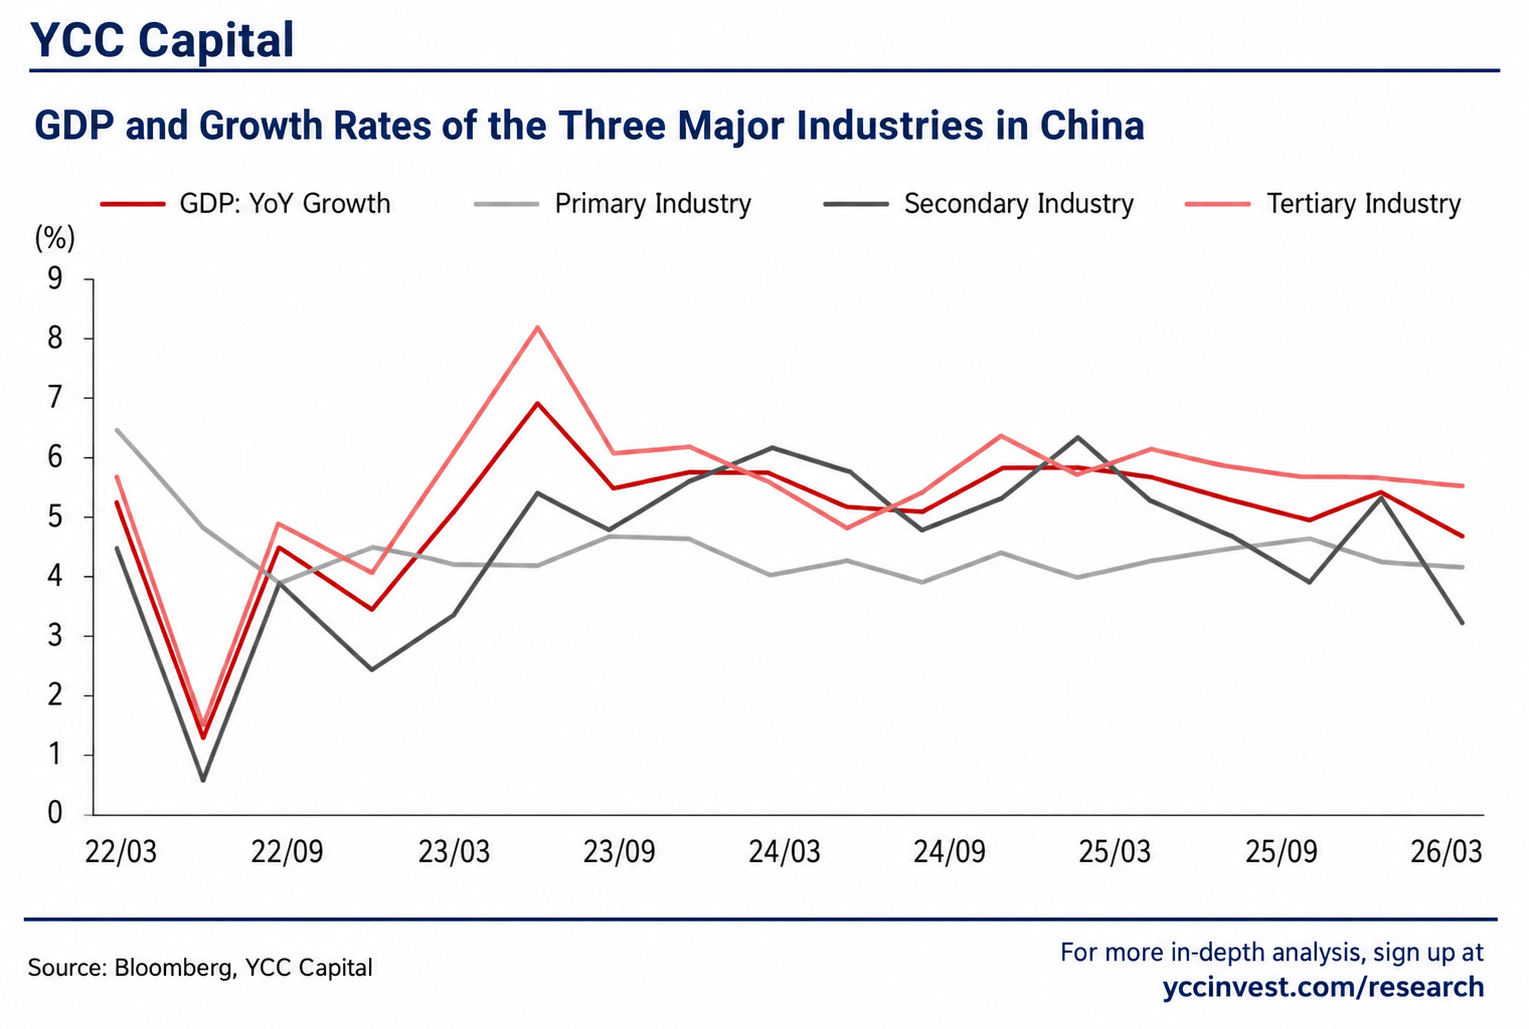
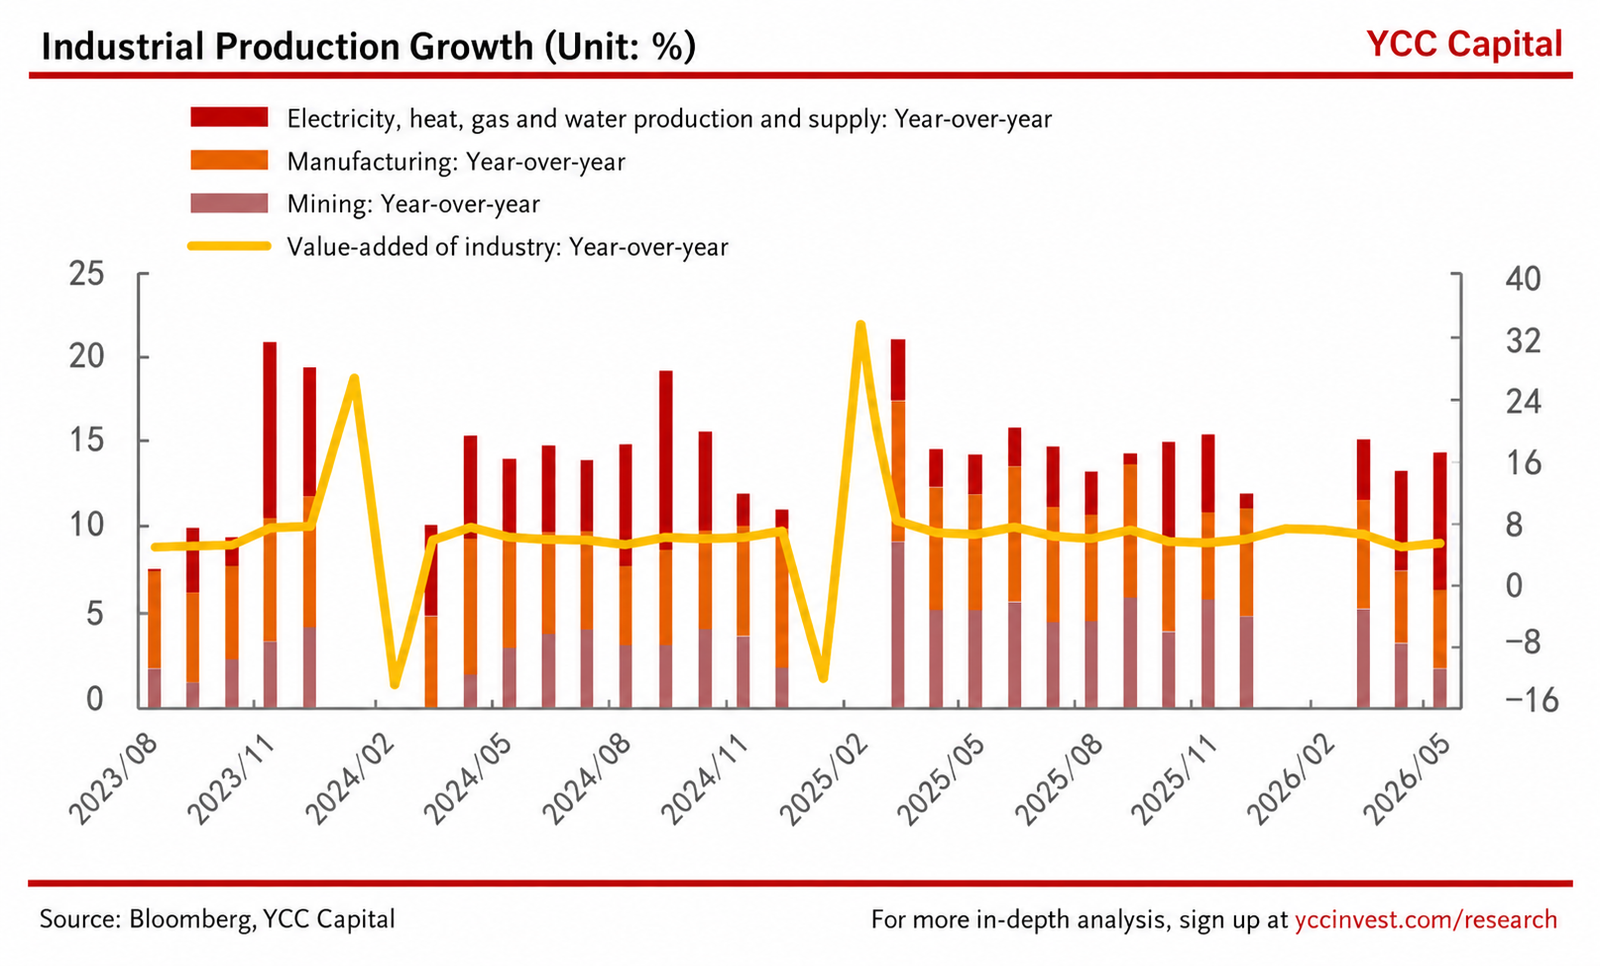
YCC CAPITAL Emerging Markets & China Strategy July 17, 2026 Executive Summary China’s second-quarter economic data paints a picture that is simultaneously reassuring in the short term and increasingly concerning beneath the surface. Headline GDP growth slowed to 4.3% year-over-year, missing market expectations of 4.5% and decelerating sharply from 5.0% in the first quarter. While June activity indicators—including industrial production and retail sales—surprised positively, these improvements were largely cyclical rather than structural. The broader message is difficult to ignore. China’s economy is increasingly dependent on external demand and high-tech manufacturing while traditional domestic growth engines—property, private investment, and household confidence—remain deeply impaired. The divergence between resilient production and weak domestic demand continues to widen, creating an increasingly unbalanced recovery. For investors, this resembles a company that continues reporting respectable revenue growth while its underlying customer base steadily weakens. Strong exports and industrial output keep headline numbers respectable, but the foundations supporting long-term growth continue to erode. From YCC Capital’s perspective, the latest data reinforce our view that China’s economy is entering a prolonged period of structurally slower expansion. Additional fiscal easing may cushion the downturn, but policymakers appear increasingly constrained by rising debt burdens, demographic headwinds, and diminishing returns from traditional stimulus. YCC Perspective: The Recovery Remains Uneven Economic recoveries rarely move in straight lines. Instead, they resemble climbing a mountain in thick fog—occasional clearings create optimism before another steep ascent emerges. China’s latest macroeconomic data fit this pattern precisely. June’s stronger industrial production and modest rebound in consumption have understandably improved market sentiment. Yet focusing solely on one month’s figures risks overlooking the broader trajectory. The second-quarter GDP slowdown demonstrates that China’s underlying growth momentum continues to weaken despite numerous rounds of targeted policy support. Rather than signaling a new acceleration cycle, June’s improvements likely reflect temporary policy support, low-base effects, and resilient export demand. None fundamentally alter the structural challenges facing the Chinese economy. Our assessment remains cautious. While cyclical rebounds are likely over coming quarters, the probability of returning to the high-growth model that characterized previous decades appears increasingly remote. Growth Slows More Than Expected China’s economy expanded 4.3% year-over-year in the second quarter, below both consensus expectations and the previous quarter’s 5.0% pace. On a sequential basis, GDP increased 0.9% quarter-over-quarter, matching expectations but slowing from 1.3% previously. Although headline growth remains respectable by international standards, composition matters far more than the aggregate figure. The slowdown reflects persistent weakness across several domestic sectors: Property investment remains deeply negative. Fixed asset investment continues contracting. Private sector confidence remains subdued. Household consumption has yet to recover meaningfully. Government fiscal support has moderated following front-loaded spending earlier in the year. Meanwhile, stronger exports and resilient manufacturing production prevented an even sharper slowdown. This growing dependence on external demand leaves China increasingly vulnerable to shifts in global trade conditions. Unlike previous recoveries driven by synchronized improvements across investment, consumption, and manufacturing, today’s expansion resembles a stool balanced unevenly on a single leg. Industrial Production Continues to Outperform Domestic Demand One of the brightest spots within the June data was industrial production. Industrial output increased 5.3% year-over-year, comfortably exceeding expectations of 4.7%. The improvement reflects several supportive factors: Strong overseas demand. Inventory rebuilding among global manufacturers. Recovery in export-oriented industries. Improved factory utilization rates. High-tech manufacturing remains especially impressive. Industries including semiconductors, computing equipment, aerospace, transportation equipment, and advanced electronics continue delivering double-digit production growth. This divergence highlights one of China’s defining economic characteristics today. Rather than broad-based industrial expansion, growth has become increasingly concentrated in strategic sectors heavily supported by industrial policy. Traditional industries continue experiencing significantly weaker investment and profitability. The resulting “K-shaped” recovery—where advanced manufacturing thrives while conventional sectors stagnate—has become increasingly pronounced. For investors, this concentration creates opportunities in selected industries but raises broader macroeconomic concerns regarding employment, income growth, and domestic demand. Services Continue Recovering—but Momentum Is Moderating China’s service sector remained relatively resilient. The services production index increased 4.7% year-over-year during June. Information technology services, software, commercial services, and leasing activities continue outperforming broader economic activity. Digitalization, artificial intelligence investment, and cloud infrastructure remain powerful structural tailwinds. However, financial services growth moderated as equity market activity softened during June. Meanwhile, many consumer-facing service industries continue recovering only gradually. While service consumption remains considerably healthier than goods consumption, overall momentum has begun stabilizing rather than accelerating. This reflects an economy where households remain willing to spend selectively on experiences while remaining cautious regarding discretionary purchases. Consumption Is Improving—but Consumers Remain Cautious Retail sales surprised positively during June. Headline retail sales increased 1.0% year-over-year, outperforming expectations following several weak months. At first glance, this appears encouraging. However, much of the improvement stemmed from: Calendar effects. Low comparison bases. Provincial consumption voucher programs. Additional “trade-in” subsidies. These temporary supports should not be mistaken for sustained demand recovery. Several durable goods categories—including automobiles, household appliances, furniture, and construction materials—continue recording weak underlying demand. The fading impact of previous trade-in programs is becoming increasingly visible. Service consumption remains healthier than goods spending, supported by tourism, entertainment, restaurants, and leisure activities. Yet households continue displaying elevated precautionary savings behavior. The average Chinese consumer today resembles someone who recently experienced a financial setback. Even after receiving a pay raise, spending habits remain conservative because confidence—not income alone—drives purchasing decisions. Until household balance sheets improve more materially, consumption is unlikely to become China’s primary growth engine. Property Remains China’s Largest Structural Headwind No sector illustrates China’s challenges more clearly than real estate. Despite numerous policy adjustments, the housing market remains firmly in correction. June data showed: Property investment declining 26.0% year-over-year. New home sales remaining weak. Property developer financing continuing to deteriorate. Construction starts falling sharply. Housing completions weakening further. Although transaction volumes have stabilized modestly in certain major cities, this represents stabilization at depressed levels rather than genuine recovery. Developers continue facing financing constraints. Local governments remain highly dependent on land sales that have yet to recover. Households remain reluctant to purchase additional property amid uncertain price expectations. Unlike previous cycles,
China’s Export Machine Keeps Winning—But the World Is Pushing Back How Market Diversification and Industrial Upgrading Are Reshaping Global Trade
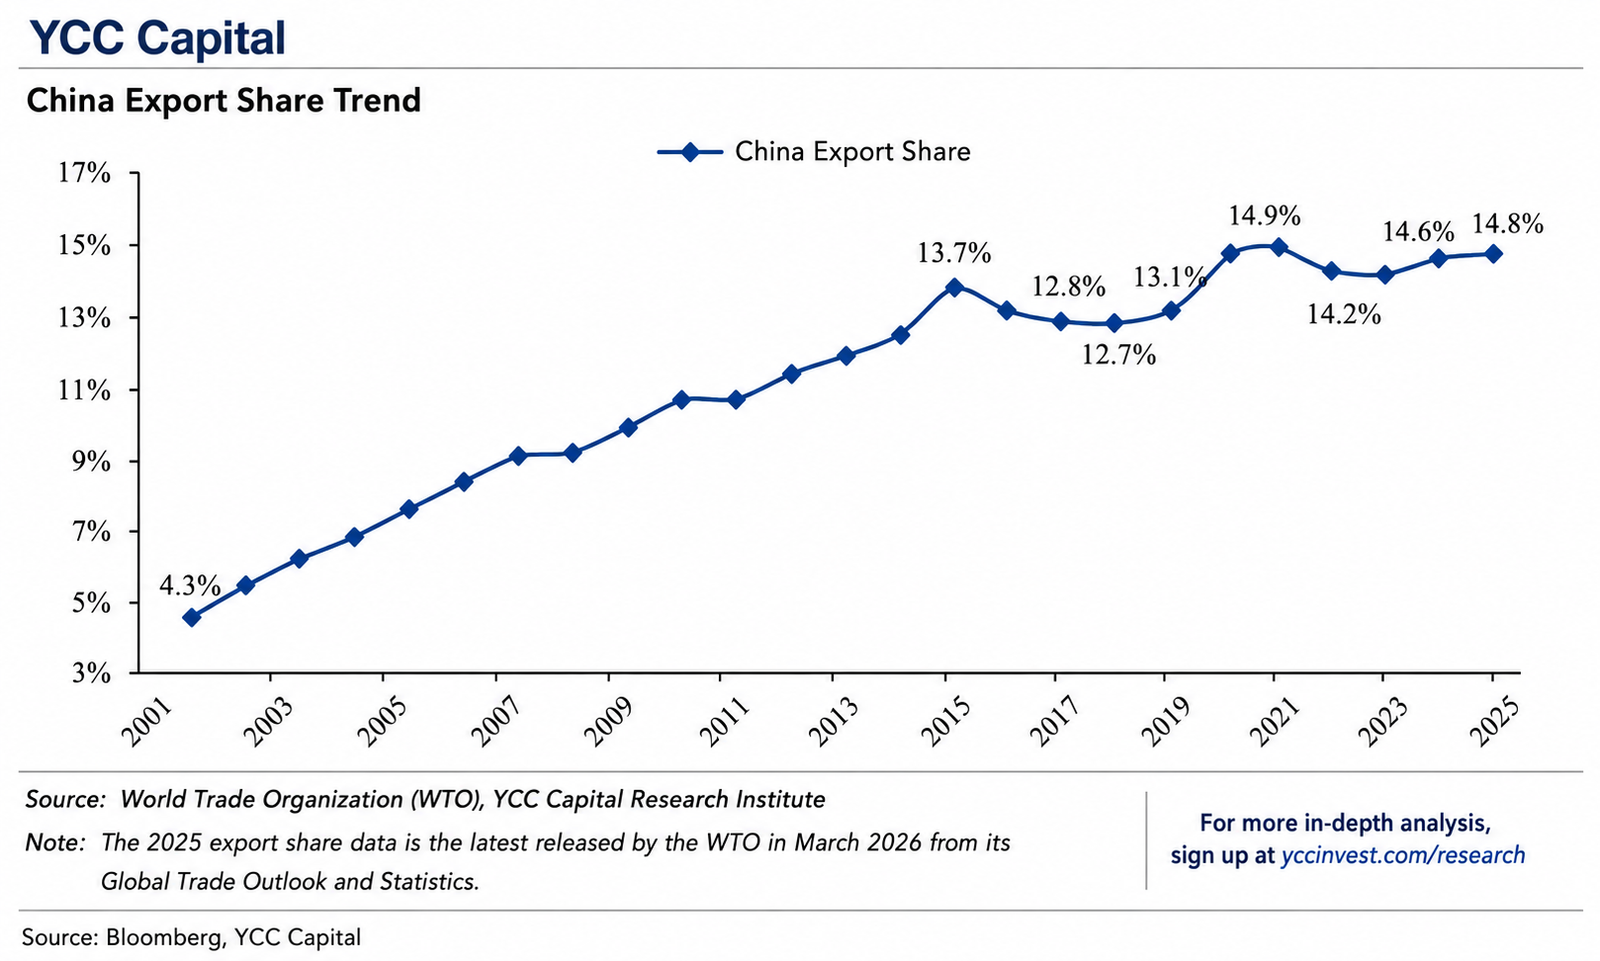
YCC CAPITAL Emerging Markets & China Strategy Date: July 12, 2026 Executive Summary Walking through a port such as Shanghai, Ningbo or Shenzhen offers a useful reminder of how globalization has evolved. Twenty years ago, endless rows of containers were filled largely with toys, garments and inexpensive household products destined for American and European consumers. Today, many of those containers carry electric vehicles, industrial machinery, lithium batteries, semiconductor components, precision instruments and increasingly sophisticated intermediate goods that are embedded deep inside global manufacturing supply chains. That transformation tells a much bigger story than simple export growth. It reflects China’s steady migration from being primarily the world’s assembly line toward becoming one of the world’s largest suppliers of industrial capital goods and manufacturing inputs. Despite an increasingly hostile geopolitical environment—including tariffs, supply-chain diversification, technology restrictions and rising protectionism—China’s share of global merchandise exports has remained remarkably resilient. According to the latest WTO estimates, China’s global export share climbed from just 4.3% in 2001 to 14.8% in 2025, approaching historical highs despite years of escalating trade tensions. At first glance, this appears paradoxical. Conventional wisdom suggested that tariffs and “decoupling” would produce a sustained decline in China’s export dominance. Instead, China’s exporters adapted. They shifted toward higher-value manufacturing, expanded aggressively into emerging markets, strengthened regional supply chains, and increasingly supplied intermediate goods rather than only finished consumer products. Yet success has also generated its own vulnerabilities. As China’s manufacturing footprint expands, political resistance abroad is becoming increasingly intense. Industrial policies across the United States, Europe, India and parts of Southeast Asia increasingly seek to reduce dependence on Chinese manufacturing while simultaneously rebuilding domestic production capacity. Rather than disappearing, globalization is becoming fragmented into overlapping regional production networks. From YCC Capital’s perspective, this distinction matters enormously. The key question is no longer whether China can continue exporting large volumes of goods. Rather, investors should ask whether China’s expanding export sector can continue offsetting mounting domestic structural weaknesses—including property-sector contraction, demographic decline, soft household consumption, and declining private-sector confidence. Exports remain one of China’s strongest cyclical pillars. They are unlikely, however, to fully compensate for broader structural headwinds over the coming decade. YCC Perspective Financial markets often focus on quarterly export numbers, but long-term competitive dynamics resemble a marathon far more than a sprint. A runner who accelerates early eventually faces stronger competition from rivals who adapt their own strategies. China’s export sector has become that early leader. Decades of investment in infrastructure, logistics, manufacturing clusters and engineering talent created extraordinary economies of scale. Those advantages remain significant today. However, every competitive advantage eventually provokes a response. Governments increasingly view supply chains through the lens of national security rather than pure economic efficiency. Trade policy has consequently become an extension of industrial policy, making future export growth increasingly dependent on geopolitics rather than simply production costs. For investors, this means distinguishing between China’s manufacturing competitiveness, which remains formidable, and China’s macroeconomic outlook, which faces considerably greater challenges. China’s Rising Share of Global Exports (2001–2025) China’s accession to the World Trade Organization in 2001 fundamentally altered the structure of global commerce. Membership provided Chinese manufacturers with greater access to international markets while simultaneously encouraging unprecedented inflows of foreign direct investment. International companies relocated production to China, attracted by abundant labor, improving infrastructure, expanding supplier ecosystems and relatively low production costs. The results were dramatic. China’s share of global merchandise exports rose steadily from 4.3% in 2001 to 13.7% by 2015, representing one of the fastest expansions in modern trade history. During this period, China increasingly became the central manufacturing hub for countless multinational supply chains. Several episodes during this expansion deserve particular attention. First, China’s export share continued rising even during periods when global trade itself weakened. During both the Global Financial Crisis and subsequent cyclical downturns, China’s relative competitiveness improved despite slower worldwide demand. In other words, China was not simply benefiting from a larger global market—it was steadily capturing market share from competing producers. Second, the first meaningful slowdown in China’s export share occurred before the formal escalation of U.S.–China trade tensions. Between 2015 and 2017, China’s global export share slipped modestly from 13.7% to 12.8%, reflecting the gradual relocation of lower-value manufacturing industries toward lower-cost economies such as Vietnam, Bangladesh and Cambodia. Rising wages, land prices and environmental compliance costs made certain labor-intensive industries less competitive. This distinction is important because it demonstrates that structural upgrading—not tariffs alone—was already reshaping China’s manufacturing base. Trade friction accelerated an existing trend rather than creating it. Third, although the U.S. tariff campaign beginning in 2018 temporarily reduced China’s export share, the impact proved less durable than many observers anticipated. China’s export share dipped modestly during 2018 before recovering during 2019 as manufacturers adapted through supply-chain adjustments, transshipment routes, overseas assembly operations and broader geographic diversification. The COVID pandemic then created an extraordinary temporary boost. China reopened manufacturing earlier than most competing economies, allowing its factories to supply products while much of the rest of the world remained constrained by lockdowns. This temporary “supply substitution” effect pushed China’s export share to approximately 14.9% during 2021, the highest level on record at the time. Some normalization followed in 2022 as competing production capacity returned. However, beginning in 2024 China’s export share resumed its upward trajectory despite intensifying geopolitical pressure. This renewed strength reflected a structural evolution rather than another temporary pandemic-related distortion. Instead of relying primarily on inexpensive consumer products, Chinese exporters increasingly captured demand in higher-value industrial sectors where global investment remained strong. From YCC Capital’s perspective, this represents the single most important development in understanding China’s modern export performance. The composition of exports has become significantly more important than the absolute volume of exports. Traditional labor-intensive industries have gradually become less central to China’s external sector. In their place, advanced manufacturing, industrial equipment, renewable-energy technologies and sophisticated intermediate goods increasingly define China’s competitive advantage. This transition helps explain why trade restrictions have slowed—but not reversed—China’s export expansion. Unlike garments or footwear, complex industrial products
The Era of the Creditless Recovery: Why China’s New Economy Is Breaking the Old Financial Cycle
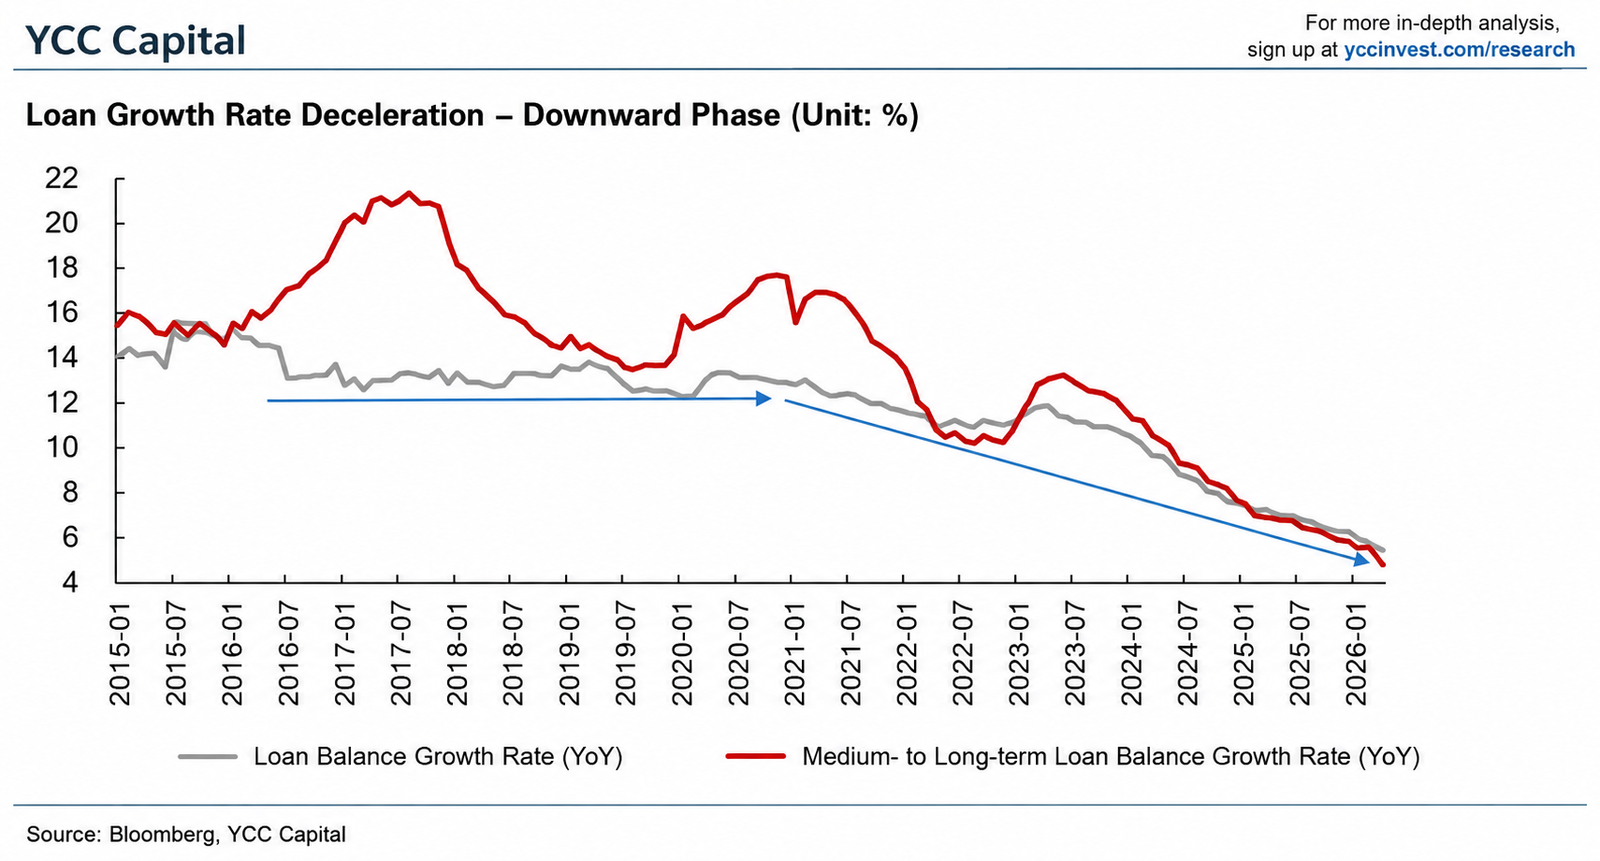
YCC CAPITAL Emerging Markets & China Strategy July 11, 2026 Executive Perspective There are moments in economic history when the indicators investors have relied upon for decades suddenly lose their predictive power. It is much like driving with an old map after an entirely new highway has been built—the landmarks remain familiar, but they no longer determine the fastest route. China may now be entering precisely such a phase. For more than twenty years, investors viewed Chinese credit growth as the country’s master economic indicator. When loan creation accelerated, growth typically followed. When credit tightened, activity slowed. The relationship was sufficiently reliable that global investors came to treat China’s “credit impulse” as one of the world’s most important macro indicators. That framework is becoming increasingly obsolete. Our analysis suggests that China’s economy is undergoing a structural transition in which traditional bank lending no longer serves as the dominant engine of investment or growth. The country’s old debt-intensive sectors—particularly real estate and infrastructure—are steadily giving way to technology manufacturing, digital infrastructure, artificial intelligence, and advanced industrial production. These industries require significantly less leverage, rely more heavily on equity financing and retained earnings, and therefore weaken the historical relationship between credit expansion and economic activity. The result could be an unfamiliar but increasingly plausible scenario: an economy capable of generating moderate growth without a corresponding acceleration in bank lending—a “creditless recovery.” This does not imply that China’s structural challenges have disappeared. Quite the opposite. The country’s property correction, demographic headwinds, local government indebtedness, and declining private-sector confidence continue to constrain long-term potential. Nevertheless, investors should recognize that the transmission mechanism of China’s economy is changing. Credit data alone may no longer provide sufficient insight into future growth. The End of China’s Credit-Led Growth Model Since 2021, China’s banking system has experienced a pronounced deceleration in lending growth. Outstanding medium- and long-term loans have slowed from annual growth exceeding 17% at the end of 2020 to below 5% by early 2026, the weakest pace in many years. New medium- and long-term lending has repeatedly surprised to the downside, while commercial bill yields have fallen toward historically low levels—clear evidence that underlying credit demand remains subdued. At first glance, these numbers appear deeply recessionary. Historically, such a collapse in loan growth would have signaled a sharp deterioration in economic momentum. Yet economic activity has proven considerably more resilient than traditional models would imply. The explanation lies not simply in cyclical weakness but in structural transformation. China’s economy is gradually replacing one financing model with another. Property No Longer Dominates Capital Allocation For much of the previous decade, property development and infrastructure investment absorbed the overwhelming majority of new credit creation. At their peak around 2017, these sectors accounted for roughly two-thirds of all new lending issued by Chinese banks, receiving well over RMB 8 trillion annually. The financial system effectively revolved around real estate, with developers, local governments, construction firms, and related industries serving as the principal borrowers. That era has ended. Following tighter regulatory oversight, the collapse of highly leveraged developers, and continued weakness in housing demand, real estate’s capacity to absorb credit has deteriorated dramatically. By 2025, our estimates suggest that infrastructure and property together accounted for only around 12% of newly created bank credit. Property-related lending alone has declined by approximately RMB 850 billion compared with previous years, becoming one of the largest drags on aggregate credit growth. Rather than representing a temporary downturn, this reflects a permanent adjustment in China’s capital allocation. The economy is no longer organized around building additional apartments. Direct Financing Is Replacing Bank Loans Another critical development is the rapid expansion of direct financing. Historically, bank lending dominated China’s social financing system. Credit represented more than three-quarters of total financing as recently as 2021. That share has steadily declined. Meanwhile, government bond issuance, corporate bond markets, and domestic equity financing have become increasingly important sources of capital. By early 2026, the proportion of total social financing represented by traditional bank credit had fallen to approximately 56%, while direct financing had nearly doubled its contribution to almost 40%. This evolution reflects the financing preferences of China’s emerging industries. Unlike property developers, technology companies rarely depend primarily on large bank loans. Software firms, semiconductor designers, cloud infrastructure providers, internet platforms, and AI developers typically finance expansion through retained earnings, venture capital, equity issuance, strategic investors, and public markets. Their balance sheets are fundamentally different. Consequently, weaker loan growth no longer necessarily implies weaker investment. AI Is Becoming Larger Than Real Estate Perhaps the most significant structural shift is occurring within China’s industrial composition itself. Using input-output analysis, we estimate that the combined AI ecosystem—including computing hardware, communications equipment, semiconductor components, software development, internet services, information technology services, power equipment supporting data centers, and related digital infrastructure—has expanded rapidly over recent years. Its direct contribution to GDP has risen from approximately 5.3% in 2020 to around 6.6% by 2023. Once upstream and downstream supply-chain effects are incorporated, AI-related industries may already account for nearly 15% of Chinese GDP by 2025. That compares with an estimated 12.7% for the broader real estate ecosystem. In other words, China’s new economy may now exceed its old economy in economic importance. This crossover represents far more than a statistical milestone. For decades, virtually every major cyclical upswing in China began with housing construction. Today, the country’s largest growth engine increasingly consists of data centers, semiconductor fabrication, industrial automation, robotics, software services, cloud computing, and artificial intelligence infrastructure. The nature of investment has fundamentally changed. New Industries Need Less Debt An equally important distinction lies in capital structure. Property developers traditionally operated with asset-liability ratios exceeding 70%. Many AI-related industries operate comfortably below 50%. Manufacturing firms have certainly increased borrowing since 2020, supported by industrial policy initiatives, but overall financing needs remain substantially smaller than those associated with nationwide property expansion. Likewise, information technology and software sectors continue to rely heavily on equity capital and internal cash generation. This difference carries profound macroeconomic
Imported Inflation Fades, Domestic Weakness Persists: Why China’s Price Recovery Remains Fragile Despite Producer Strength
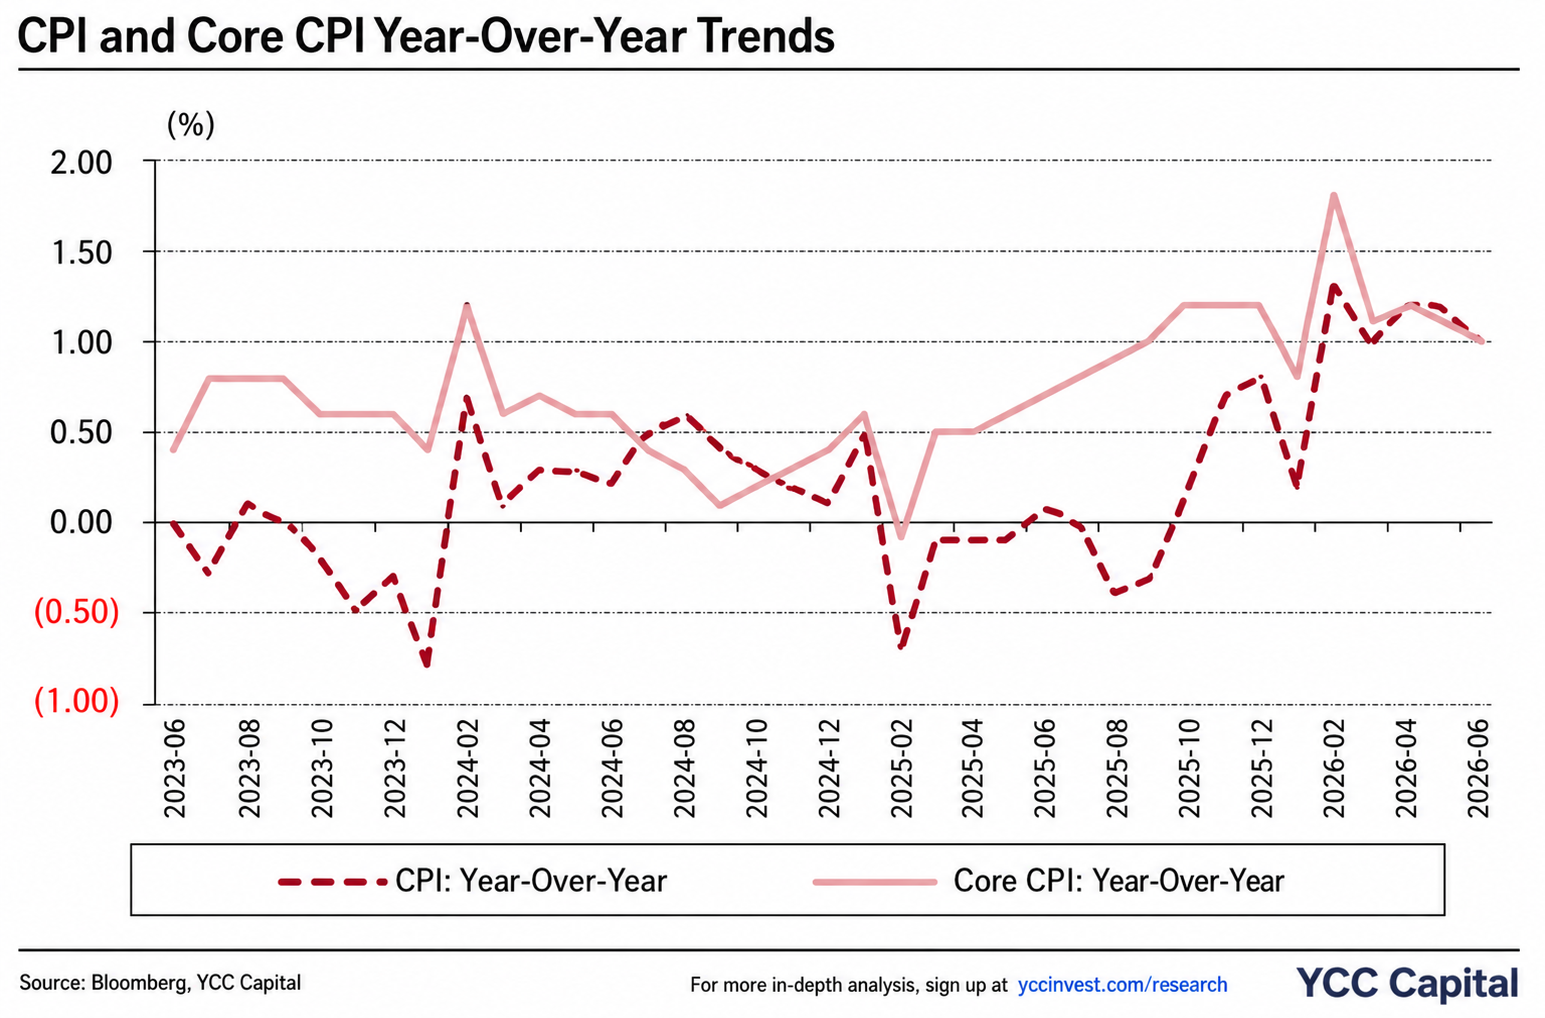
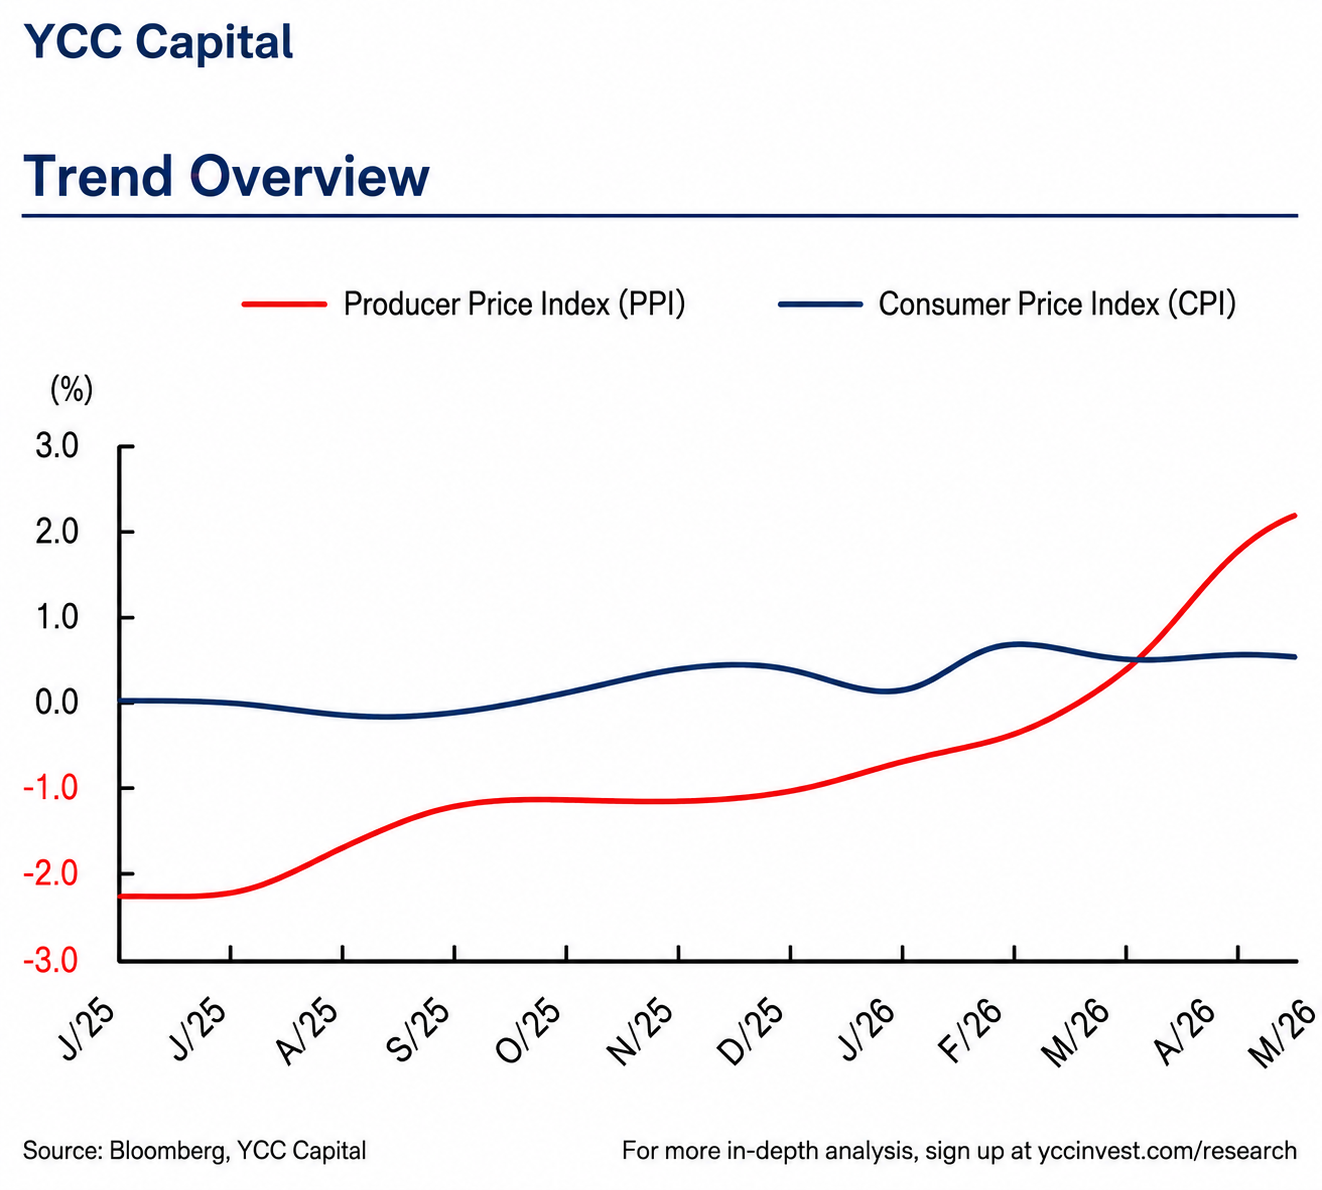
YCC CAPITAL Emerging Markets & China Strategy July 10, 2026 Executive Perspective Inflation is often described as the economy’s pulse. Sometimes it races, sometimes it slows, but what matters most is understanding why it changes. China’s June inflation report presents precisely this challenge. On the surface, the data appear mixed: consumer inflation eased while producer prices accelerated further. Yet beneath the headline numbers lies a more nuanced story—one shaped less by a resurgence in domestic demand than by fluctuations in global commodity markets and technological investment. For investors, this distinction is critical. A healthy inflation cycle is typically driven by improving household income, stronger consumption, and broad-based pricing power. China’s latest figures instead suggest that external commodity shocks and selective industrial upgrading continue to dominate price formation, while consumer demand remains subdued. At YCC Capital, we believe the June inflation report reinforces our broader macro view: China’s industrial sector is benefiting from pockets of technological upgrading and higher commodity costs, but the broader economy continues to struggle with insufficient domestic demand, weak property-related wealth effects, and cautious consumer behavior. Producer inflation may remain elevated for longer, yet consumer inflation is unlikely to develop into a sustained inflationary cycle. Key Takeaways June CPI declined 0.3% month-over-month while rising 1.0% year-over-year, slightly below market expectations. Core CPI also increased 1.0%, suggesting that underlying demand remains relatively stable but far from robust. Producer prices continued their upward trend. PPI increased 4.1% year-over-year, surpassing the 4% threshold for the first time in the current cycle, reflecting stronger industrial pricing driven by commodities, artificial intelligence investment, and manufacturing upgrades. The divergence between CPI and PPI illustrates a familiar pattern in China’s economy: industrial producers are benefiting from external pricing dynamics and policy-supported investment, while households remain considerably more cautious. Source: Bloomberg, YCC Capital Consumer Inflation: Imported Factors Dominate Headline CPI slowed modestly during June, but the underlying drivers reveal that domestic demand was not the principal cause. Instead, imported price movements accounted for much of the fluctuation. International gold prices corrected during the month, causing domestic jewelry prices to decline sharply. At the same time, lower international crude oil prices reduced gasoline prices across China. Together, these two categories alone reduced monthly CPI by approximately 0.22 percentage points, accounting for the majority of June’s decline. By contrast, services inflation remained remarkably steady. Service prices rose 0.8% year-over-year, essentially unchanged from May, suggesting that domestic consumption has stabilized but has not meaningfully accelerated. This is consistent with broader evidence seen across China’s retail sales, consumer confidence, and household savings behavior. Chinese households continue to prioritize balance sheet repair over discretionary spending, reflecting ongoing uncertainty surrounding employment, income growth, and the property market. Walking through many Chinese shopping districts today illustrates this reality. Restaurants remain open, shopping malls remain busy during weekends, yet spending per customer remains restrained. Consumers browse carefully, compare prices, and increasingly seek promotions rather than premium products. The economy is moving—but not with the confidence typically associated with a strong inflationary cycle. Food Inflation Remains Highly Uneven Food prices continued to provide a modest drag on headline inflation. Overall food prices declined 1.6% year-over-year, although the pace of decline narrowed slightly compared with May. Within the category, however, significant divergence emerged. Seasonal supply remained abundant for fresh vegetables and fruits, leading to further price declines as harvests entered the market. Pork prices also continued falling, although the rate of decline moderated compared with previous months. Egg prices moved in the opposite direction. Reduced laying capacity combined with unusually high summer temperatures constrained supply, pushing egg prices sharply higher during June. Such divergence highlights an increasingly important feature of China’s inflation dynamics: rather than broad demand-driven inflation, individual supply-side factors continue to dominate specific categories. Looking ahead, weather may become a more important variable than monetary policy. The Politburo has warned that El Niño conditions may increase the frequency of floods and droughts during the peak summer season. Extreme weather could temporarily disrupt fruit and vegetable production, creating short-term food inflation even as underlying consumer demand remains weak. Energy Markets Continue to Drive Inflation Volatility Geopolitical developments remain an increasingly important source of inflation uncertainty. Although oil prices softened during much of June, developments in the Middle East have once again increased supply risks. Recent military escalation involving Iran has renewed concerns regarding tanker traffic through the Strait of Hormuz, one of the world’s most strategically important energy corridors. Any prolonged disruption could rapidly reverse recent declines in crude oil prices. For China, which remains heavily dependent on imported energy, such developments directly affect transportation costs, industrial production, and consumer inflation. Unlike demand-driven inflation, imported inflation leaves policymakers with limited tools. Interest rate adjustments cannot increase oil production or reopen disrupted shipping routes. This explains why inflation forecasting has become increasingly dependent on geopolitical analysis alongside traditional macroeconomic indicators. Producer Prices Continue to Strengthen While consumer inflation softened, producer prices continued strengthening. June PPI increased 4.1% year-over-year, rising from 3.9% in May. Production materials increased 5.5%, while consumer goods prices remained slightly negative at -0.9%, reinforcing the divide between industrial activity and household demand. After eight consecutive months of positive monthly increases, producer prices declined modestly on a month-over-month basis during June as lower oil prices weighed on energy-related industries. However, the broader annual trend remained firmly positive. Several sectors experienced particularly strong pricing gains. Coal mining, electrical equipment manufacturing, electronics production, and steel processing all recorded stronger year-over-year price growth than in May. Meanwhile, energy-intensive industries linked to oil refining and chemicals experienced some moderation as crude prices retreated during the month. Overall, producer inflation increasingly reflects structural industrial transformation rather than broad cyclical recovery. Artificial Intelligence Is Beginning to Influence Factory Prices One of the more notable developments within China’s producer price data is the growing influence of artificial intelligence and advanced manufacturing. Demand for industrial robots, intelligent wearable devices, industrial control systems, specialized electronic materials, virtual reality equipment, and advanced carbon-based materials continued pushing factory prices higher. This represents an
Anchoring Through the Turbulence: Why China’s Growth Model Is Entering Its Most Consequential Transition Yet
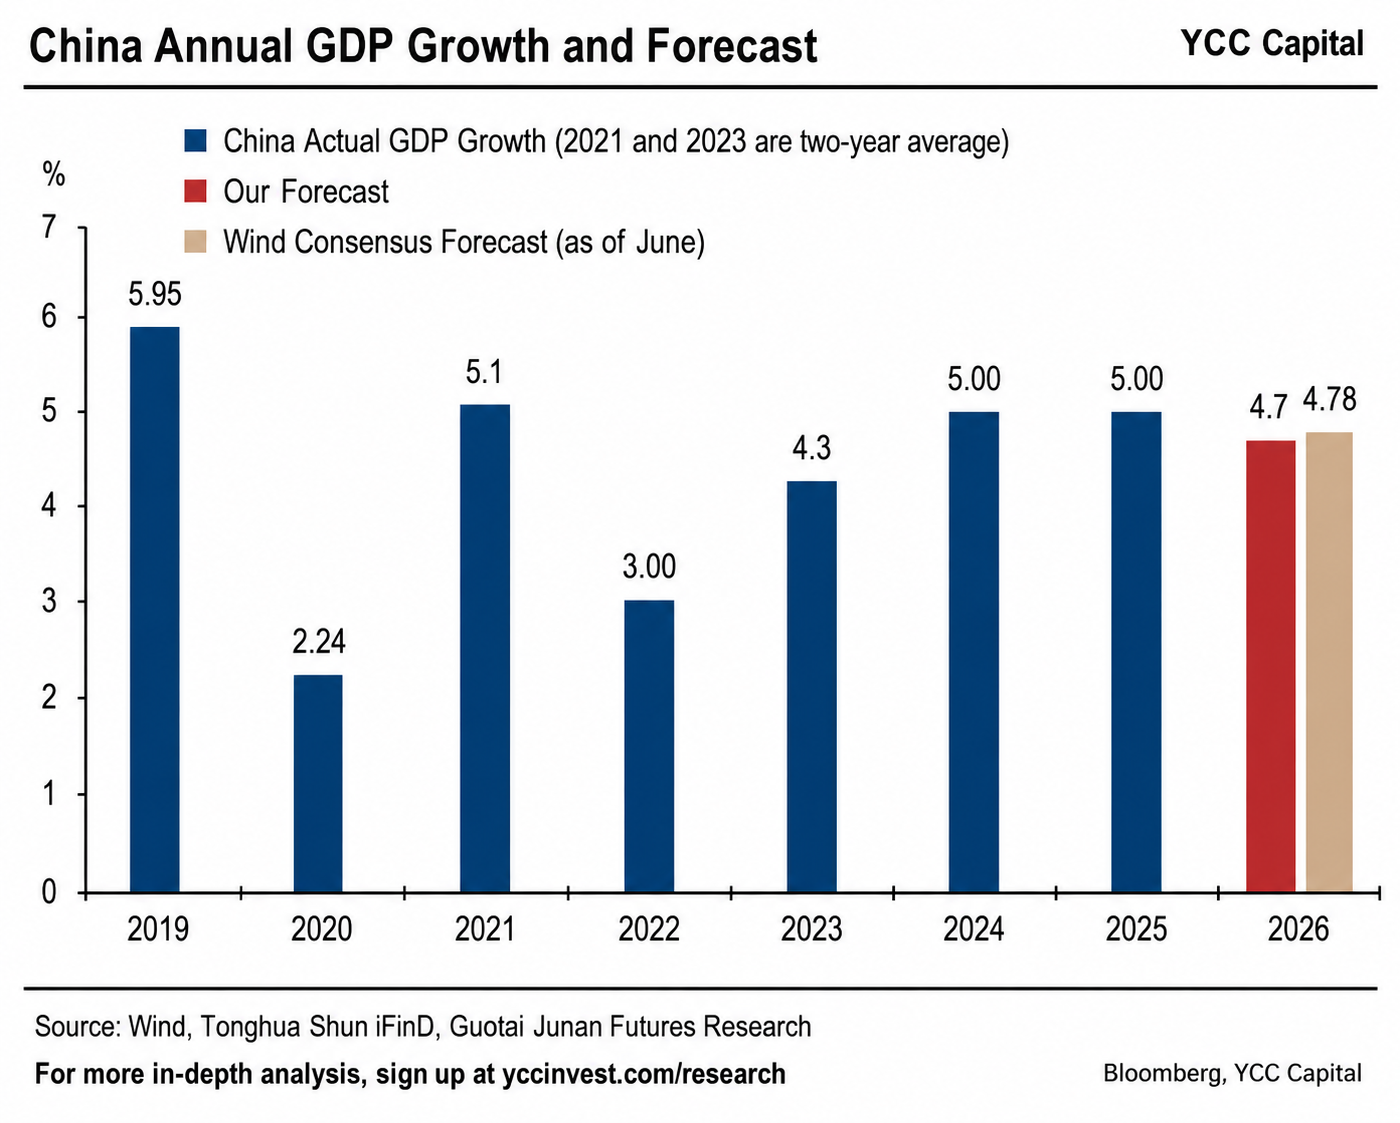
YCC CAPITAL Emerging Markets & China Strategy June 30, 2026 Executive Perspective Markets often resemble an experienced sailor navigating changing tides. Calm waters can create the illusion of stability, while the strongest undercurrents remain invisible beneath the surface. China’s economy today fits that description remarkably well. Headline growth continues to hover around official targets, yet underneath lies one of the largest reallocations of capital, labor, and political priorities in decades. At YCC Capital, we believe investors should resist viewing China through either excessively pessimistic or overly optimistic lenses. Instead, the current environment should be understood as a prolonged transition from a property-led economy toward one increasingly dependent on advanced manufacturing, strategic technology, exports, and state-directed industrial policy. This transition is producing winners and losers simultaneously, creating a pronounced K-shaped economy that is likely to remain the defining feature of China’s macro landscape over the coming several years. The second half of 2026 is therefore unlikely to deliver either a dramatic acceleration or a hard landing. Rather, policymakers appear increasingly willing to tolerate moderate growth in exchange for structural reforms, industrial upgrading, and financial stability. While targeted policy support should prevent a severe downturn, the economy continues to face significant headwinds from weak domestic demand, lingering property weakness, unfavorable demographics, and an increasingly uncertain global environment. Against this backdrop, we expect China’s economy to remain resilient in externally oriented manufacturing sectors while domestic consumption and property continue to recover only gradually. Export competitiveness, technological upgrading, and selective fiscal support should offset part—but not all—of the structural drag from deleveraging and slowing household confidence. China’s Economy: Stable Growth Masks Structural Divergence China entered 2026 with stronger-than-expected momentum. The first quarter benefited from robust exports, resilient industrial production, and continued investment in high-technology manufacturing. However, momentum moderated noticeably beginning in April as fiscal spending slowed, domestic demand weakened more than anticipated, and geopolitical disruptions in the Middle East temporarily affected global production chains. Rather than signaling a new recession, the slowdown reflects the increasingly uneven nature of China’s growth model. Export-oriented industries continue to outperform while domestically focused sectors remain under pressure. We expect GDP growth to follow a pattern of moderation before stabilizing later in the year. Our base case projects: Q2 GDP growth: 4.6% Q3 GDP growth: 4.7% Q4 GDP growth: 4.7% Full-year GDP is expected to expand by approximately 4.7%, comfortably within the government’s stated target range of 4–5%. The second half should benefit from easier year-over-year comparisons, gradual fiscal acceleration, and implementation of several structural policy initiatives. Nevertheless, growth is unlikely to return to the rapid pace experienced during previous stimulus cycles, reflecting policymakers’ preference for higher-quality expansion over headline speed. Manufacturing Has Become China’s New Growth Engine One of the defining characteristics of China’s post-pandemic economy has been the widening gap between production and consumption. Industrial production continues to significantly outperform retail spending, highlighting China’s increasing dependence on external demand and technological upgrading. Between January and May, industrial value-added grew 5.4%, substantially exceeding retail sales growth of only 1.4%. This divergence reflects two powerful global forces. First, the ongoing AI revolution has triggered an unprecedented wave of investment in semiconductors, data infrastructure, industrial automation, and advanced electronics. Chinese manufacturers remain deeply integrated into these global supply chains despite geopolitical tensions. Second, global re-industrialization has encouraged multinational firms to diversify production networks. Although some manufacturing has migrated elsewhere in Asia, China’s sophisticated supplier ecosystem continues to provide significant competitive advantages in many high-value manufacturing sectors. High-technology industries have therefore increasingly diverged from traditional manufacturing, reinforcing the country’s transition toward “new productive forces.” Property Is No Longer Driving Growth Perhaps the most profound structural shift underway is the diminished role of real estate. Property investment remains the weakest component of China’s economy. During the first five months of 2026, real estate investment declined 16.2% year-over-year, marking an extraordinary 46 consecutive months of contraction. Several years ago, such a decline would almost certainly have pushed China into recession. Today, the macroeconomic impact is considerably smaller because technology-intensive industries now account for a larger share of economic activity than construction. Nevertheless, real estate remains an important drag on household wealth, consumer confidence, and commodity demand. Encouragingly, leading indicators suggest stabilization rather than continued collapse. Tier-one cities have experienced noticeable improvements in housing prices and transaction volumes as inventories gradually normalize. However, these improvements remain geographically concentrated and insufficient to drive a nationwide recovery. China’s property market appears to be establishing a cyclical floor rather than beginning a new expansion. Excess inventory remains elevated, and meaningful recovery will likely require continued policy support alongside sustained inventory reduction. For global investors, this distinction is critical. The era in which Chinese real estate served as the principal engine of commodity demand has likely ended. Infrastructure Spending Faces New Constraints Infrastructure investment has traditionally served as Beijing’s preferred counter-cyclical policy tool. This time, however, local government debt has fundamentally altered that equation. Broad infrastructure investment slowed steadily during the first four months of 2026, reflecting an accelerated campaign to reduce local government financial risks. Although government bond issuance has proceeded relatively quickly this year, fiscal spending has become increasingly selective rather than expansionary. Rather than maximizing headline investment, policymakers now appear focused on balancing economic stabilization with debt sustainability. This represents an important philosophical shift in Chinese policymaking. Instead of repeating the massive infrastructure stimulus programs that characterized previous downturns, Beijing increasingly favors targeted investment supporting long-term productivity improvements. Manufacturing Investment Enters a More Mature Phase Manufacturing investment has successfully offset much of the weakness originating from property over recent years. However, after several years of exceptionally rapid expansion, signs of overcapacity have become increasingly visible across multiple industries. Low producer prices, compressed corporate margins, and declining capacity utilization prompted authorities to intensify their campaign against excessive industrial competition—commonly referred to as the “anti-involution” initiative. The objective is straightforward: improve industrial profitability rather than maximize production volume. This policy shift will likely moderate manufacturing investment growth in the near term while improving the sector’s long-term
China’s Consumer Mirage: Why Better Employment Data Is Hiding a More Fragile Recovery
YCC CAPITAL Emerging Markets & China Strategy June 30, 2026 Executive Summary At first glance, China’s latest consumption figures appear disappointing. Retail sales contracted 0.6% year-over-year in May, reinforcing the widespread perception that household demand remains weak. Yet beneath the headline lies a more nuanced picture. After adjusting for last year’s exceptionally high comparison base—driven by aggressive government subsidy programs—and temporary weather disruptions that weighed on offline consumption, sequential momentum actually improved meaningfully. The more important question, however, is not whether consumption stabilized in May. It is whether the recovery can endure. Our assessment remains cautious. The recent improvement owes much to modest gains in employment, but the composition of that employment has shifted dramatically toward flexible and gig-based work. While these jobs reduce measured unemployment, they often provide lower incomes, fewer benefits, and considerably less financial security. As a result, China’s labor market is becoming quantitatively stronger while qualitatively weaker. Anyone who has watched a city fill with food delivery riders during difficult economic times has seen this phenomenon firsthand. Streets appear busier and more people are working, yet many households remain reluctant to spend because income certainty has deteriorated. Employment exists—but confidence does not. From YCC Capital’s perspective, this structural shift represents one of the most underappreciated constraints on China’s domestic demand outlook. Until stable employment opportunities expand meaningfully, consumer confidence is unlikely to experience a sustained recovery regardless of cyclical policy stimulus. YCC Perspective Financial markets often celebrate improving unemployment statistics as evidence that economic momentum is returning. History suggests investors should instead ask a more important question: what kinds of jobs are being created? Employment quality frequently matters more than employment quantity. China today increasingly resembles other economies that experienced rapid growth in gig employment following periods of structural slowdown. Headline labor statistics improve, yet wage growth remains subdued and precautionary savings continue rising. That distinction will likely determine whether China’s long-awaited consumer recovery finally materializes—or remains another false dawn. Consumption Is Improving at the Margin—but the Foundation Remains Fragile Headline retail sales slowed to -0.6% year-over-year in May, seemingly indicating further deterioration in domestic demand. However, this figure deserves careful interpretation. Last year’s nationwide consumer subsidy programs created unusually high comparison effects, particularly for household appliances and durable goods. In addition, unusually heavy rainfall disrupted brick-and-mortar consumption across several regions during May. Sequential data therefore paint a considerably less pessimistic picture. Month-over-month retail activity outperformed historical seasonal averages and represented a noticeable improvement from April, suggesting consumer spending has begun to stabilize rather than deteriorate further. Nevertheless, stabilization should not be mistaken for recovery. Household confidence remains exceptionally sensitive to labor market conditions, property wealth, and future income expectations. While policymakers have succeeded in slowing the pace of deterioration, they have yet to generate convincing evidence of a self-sustaining consumption cycle. Employment Is Improving—But the Wrong Kind of Employment Labor market conditions continued to improve during May, with the surveyed unemployment rate declining once again. Historical evidence demonstrates a meaningful inverse relationship between unemployment and household consumption propensity. Empirical analysis suggests that every 0.1 percentage point decline in unemployment has historically lifted household consumption willingness by roughly 0.8 percentage points. Viewed narrowly, falling unemployment should therefore support stronger consumption. Yet the composition of China’s labor market tells a more complicated story. Over recent years, unemployment trends have increasingly diverged between local residents and migrant workers. While unemployment among migrant workers has declined, unemployment among locally registered residents has remained comparatively elevated. This divergence reflects one of China’s most important structural labor market transformations: the rapid expansion of flexible employment. Migrant workers have generally demonstrated greater willingness to participate in gig economy positions—including delivery services, ride-sharing, logistics, and platform-based work—whereas local residents continue to prioritize employment stability and traditional salaried positions. Recent housing provident fund enrollment data from Chongqing provide additional confirmation of this trend, showing a steadily rising proportion of flexible workers entering the formal contribution system. The implication is significant. May’s employment improvement appears to have been driven disproportionately by growth in flexible employment rather than expansion of stable, higher-quality jobs. That distinction matters enormously for the broader economy. Why Flexible Employment Limits Consumption Flexible employment carries two structural consequences that directly constrain household spending. First, income levels are generally lower. Gig workers often receive variable compensation based on completed tasks rather than fixed salaries. Their earnings fluctuate considerably across seasons and economic cycles, reducing aggregate wage growth even as total employment rises. Second, income uncertainty encourages precautionary savings. Households facing uncertain future earnings naturally become more conservative. Rather than increasing discretionary purchases, they prioritize liquidity and emergency savings. The phenomenon is hardly unique to China. Across numerous advanced economies, workers with unstable income streams consistently exhibit higher savings rates and lower discretionary consumption than households enjoying stable salaried employment. China appears to be following the same pattern. The country’s household consumption propensity has remained systematically subdued throughout 2024-2026 despite numerous policy initiatives designed to stimulate domestic demand. In our view, labor market quality provides a compelling explanation for this disconnect. Consumers do not spend confidently simply because they are employed. They spend confidently because they believe they will remain employed. Flexible Employment Cannot Become the Economy’s Final Demand An important macroeconomic limitation often receives insufficient attention. Flexible employment ultimately depends on demand generated elsewhere in the economy. Delivery platforms require consumers to place orders. Ride-hailing drivers require passengers. Freelancers require corporate clients. Platform economies cannot indefinitely create demand for themselves. Without continued expansion of stable middle-income employment, flexible employment eventually reaches diminishing returns. Current data already suggest this process may be emerging. Local resident unemployment remained near its highest seasonal level in recent years during May. Meanwhile, improvements among migrant workers may become increasingly difficult to sustain if underlying domestic demand remains weak. Recent official discussions addressing excessive competition within China’s consumer service industries further reinforce this concern. Intensifying price competition often reflects insufficient aggregate demand rather than excessive supply alone. For investors, this represents an important warning signal. Labor market stabilization
Beyond the Property Bust: How Economies Learn to Grow Without Real Estate—and What It Means for China
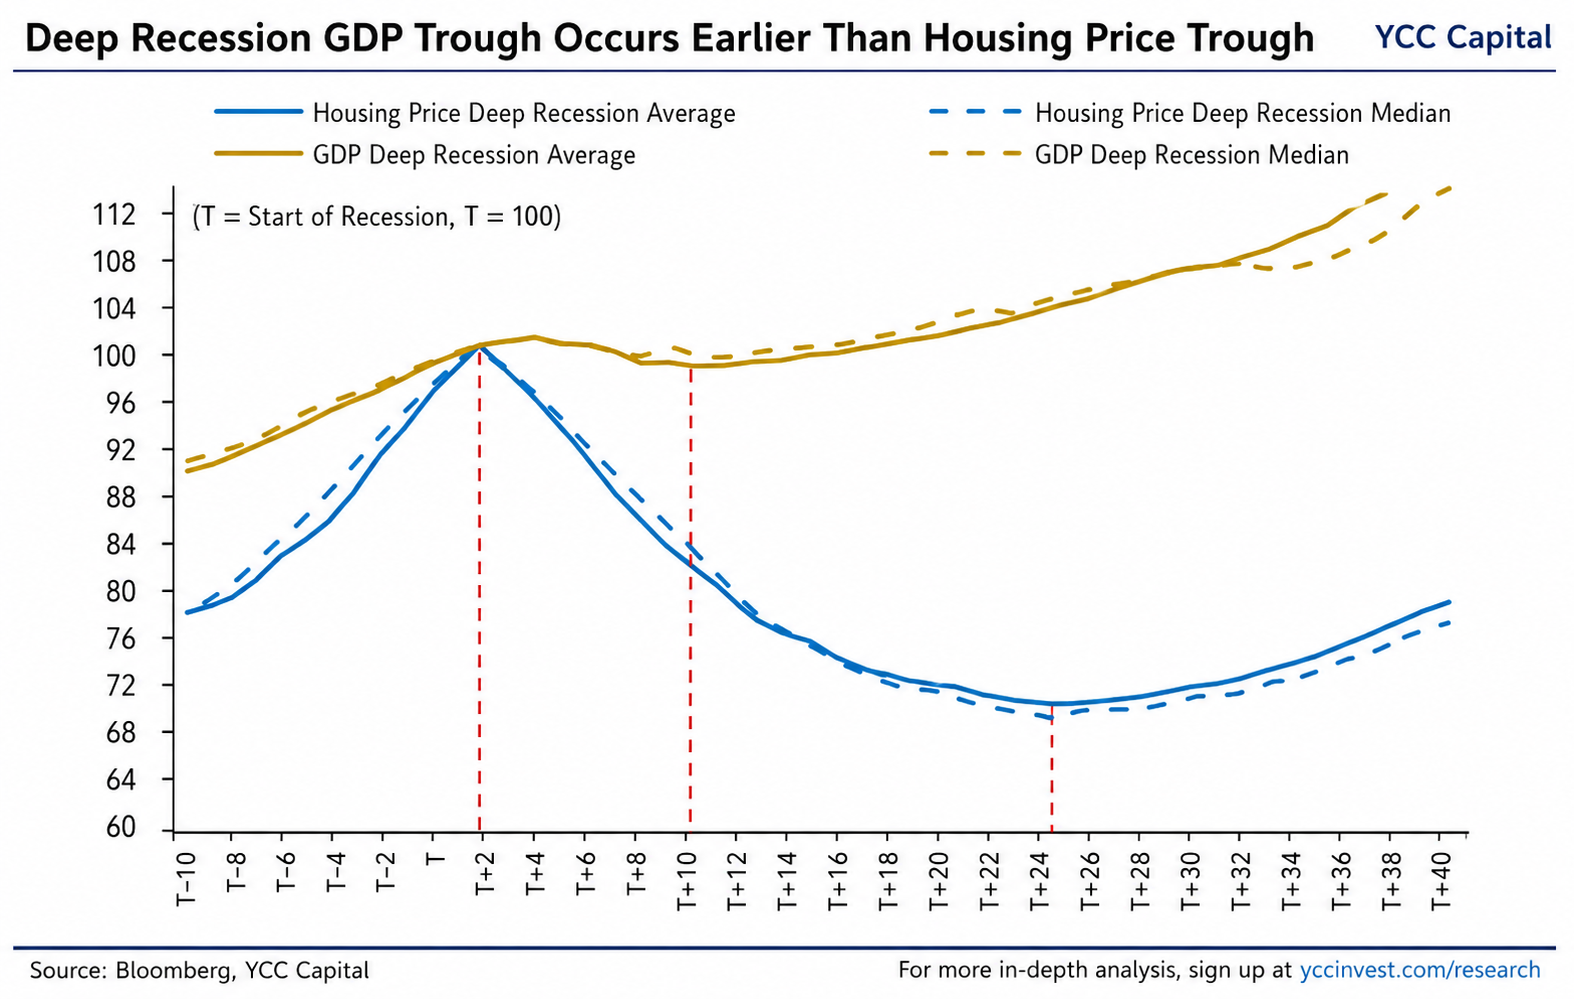
YCC CAPITAL Emerging Markets & China Strategy June 28, 2026 Executive Summary There is a familiar temptation whenever property markets weaken: investors instinctively assume that sustainable economic recovery cannot begin until housing prices stabilize. International evidence suggests the opposite is often true. Drawing on nearly six decades of data across 57 economies and 190 housing downturns, our analysis indicates that economies frequently recover well before real estate markets do. GDP typically reaches its trough approximately two years after housing prices begin falling, while residential property prices often continue declining for another three to four years. In other words, economic expansion and property recovery become partially decoupled. This phenomenon—which we describe as “de-real-estate growth”—marks one of the most important structural transitions modern economies undergo after a property boom ends. Growth no longer relies primarily on expanding mortgage credit, residential construction, or housing-related consumption. Instead, new drivers gradually emerge: stronger exports, resilient service-sector demand, manufacturing investment, infrastructure spending, and productivity-enhancing capital expenditure. History repeatedly demonstrates that economies do not simply replace one growth engine with another overnight. The adjustment resembles changing engines on an aircraft already in flight. The process is uncomfortable, uneven, and politically difficult, yet entirely possible. China today increasingly exhibits many of these characteristics. While its housing correction has not yet reached the severity observed in historical “deep contraction” episodes internationally, the composition of growth has already shifted meaningfully. Exports, manufacturing investment, infrastructure, and service consumption have become progressively larger contributors to economic activity, while the property sector’s influence continues to diminish. This transition should not be mistaken for a return to the old investment cycle. Rather, it represents a fundamental restructuring of China’s economic model. The economy may continue expanding, but not because real estate has recovered. Instead, it is learning—perhaps reluctantly—to grow without it. The Historical Pattern: GDP Recovers Before Housing One of the most consistent findings across international property cycles is the surprisingly large gap between macroeconomic stabilization and housing market stabilization. Across 48 episodes classified as severe real estate contractions, GDP generally bottoms around eight quarters after house prices begin declining. Property prices, however, do not typically reach their trough until approximately 22 quarters, or roughly five and a half years, into the downturn. The implication is profound. Economic recovery does not require housing prices to recover first. Instead, fiscal stimulus, monetary easing, export competitiveness and private-sector adaptation allow broader economic activity to stabilize while real estate continues working through excess supply, leverage and balance-sheet repair. This distinction matters enormously because investors frequently anchor their outlooks on housing indicators while overlooking improvements elsewhere in the economy. The data suggest this approach systematically underestimates the resilience of broader economic systems. One might compare it to recovering from an injury. A patient may begin walking long before the broken bone appears fully healed on an X-ray. The visible wound lingers even as underlying functionality steadily improves. The same principle frequently applies to national economies. Three Stages of De-Real-Estate Growth International experience suggests that post-property adjustments evolve through three distinct phases. Stage One: The Initial Shock The first two years are dominated by deteriorating housing activity. Falling home prices suppress residential construction, reduce household wealth, weaken confidence and slow consumption. Housing investment contracts first before weakness gradually spreads through the broader economy. During this period GDP growth typically deteriorates rapidly. Policy responses remain relatively limited initially as authorities assess whether the slowdown represents a temporary correction or a broader structural adjustment. Stage Two: Policy-Led Stabilization Around the second year, the economy generally reaches its cyclical low. Recovery begins—but it is largely policy-driven. Governments expand fiscal deficits aggressively while central banks lower interest rates to cushion private-sector deleveraging. Across international cases, fiscal deficits increased from an average of only 0.4% of GDP at the onset of housing weakness to nearly 5% of GDP roughly four years later. Meanwhile policy interest rates declined dramatically, falling from approximately 11.1% to 6.3% over the same period. This combination of easier monetary policy and expansionary fiscal support creates sufficient demand to stabilize employment and prevent deeper recessions. Yet growth during this phase remains fragile because it depends heavily on government intervention rather than private-sector momentum. Stage Three: Self-Sustaining Expansion The final stage begins roughly five years into the housing downturn. Interestingly, governments often begin reducing policy support just as economic momentum strengthens. Fiscal deficits gradually narrow. Interest-rate cuts slow or stop altogether. Despite less policy assistance, GDP continues improving. This represents the most encouraging phase because private demand increasingly replaces public stimulus. Businesses begin investing again, consumers regain confidence, exports strengthen, and the economy develops new engines of expansion independent of housing. The transition from policy dependence to market-led growth marks the true completion of de-real-estate growth. Why Housing Rarely Regains Its Former Dominance One of the most misunderstood aspects of housing cycles is what happens after recovery. Property prices may eventually stabilize. Housing construction may partially recover. Yet housing almost never regains its previous share of national output. International evidence shows residential investment averaged roughly 6.7% of GDP at its historical peak before severe contractions. Even ten years after housing prices began falling, residential investment typically recovered only to approximately 4.2% of GDP. The pattern is remarkably persistent. Consumer behavior follows a similar trajectory. Durable goods consumption—closely linked to home purchases, renovations and furnishing—also recovers only partially. Even after property markets stabilize, consumers rarely resume the same level of housing-related spending seen during previous booms. This reflects more than cyclical weakness. It reflects structural change. Once economies diversify toward services, technology, manufacturing and exports, they seldom return to relying primarily on residential property as their principal growth engine. History therefore argues against expecting China to recreate the property-driven expansion model that characterized the previous two decades. Three Engines That Replace Property If housing no longer leads growth, what does? International experience consistently identifies three major replacement engines. Export Rebalancing The first engine is external demand. During housing booms, domestic consumption and imports typically surge, compressing net exports. As housing weakens, imports
China’s Fiscal Engine Shifts Gears: Revenue Recovery Emerges While Spending Power Waits in the Wings
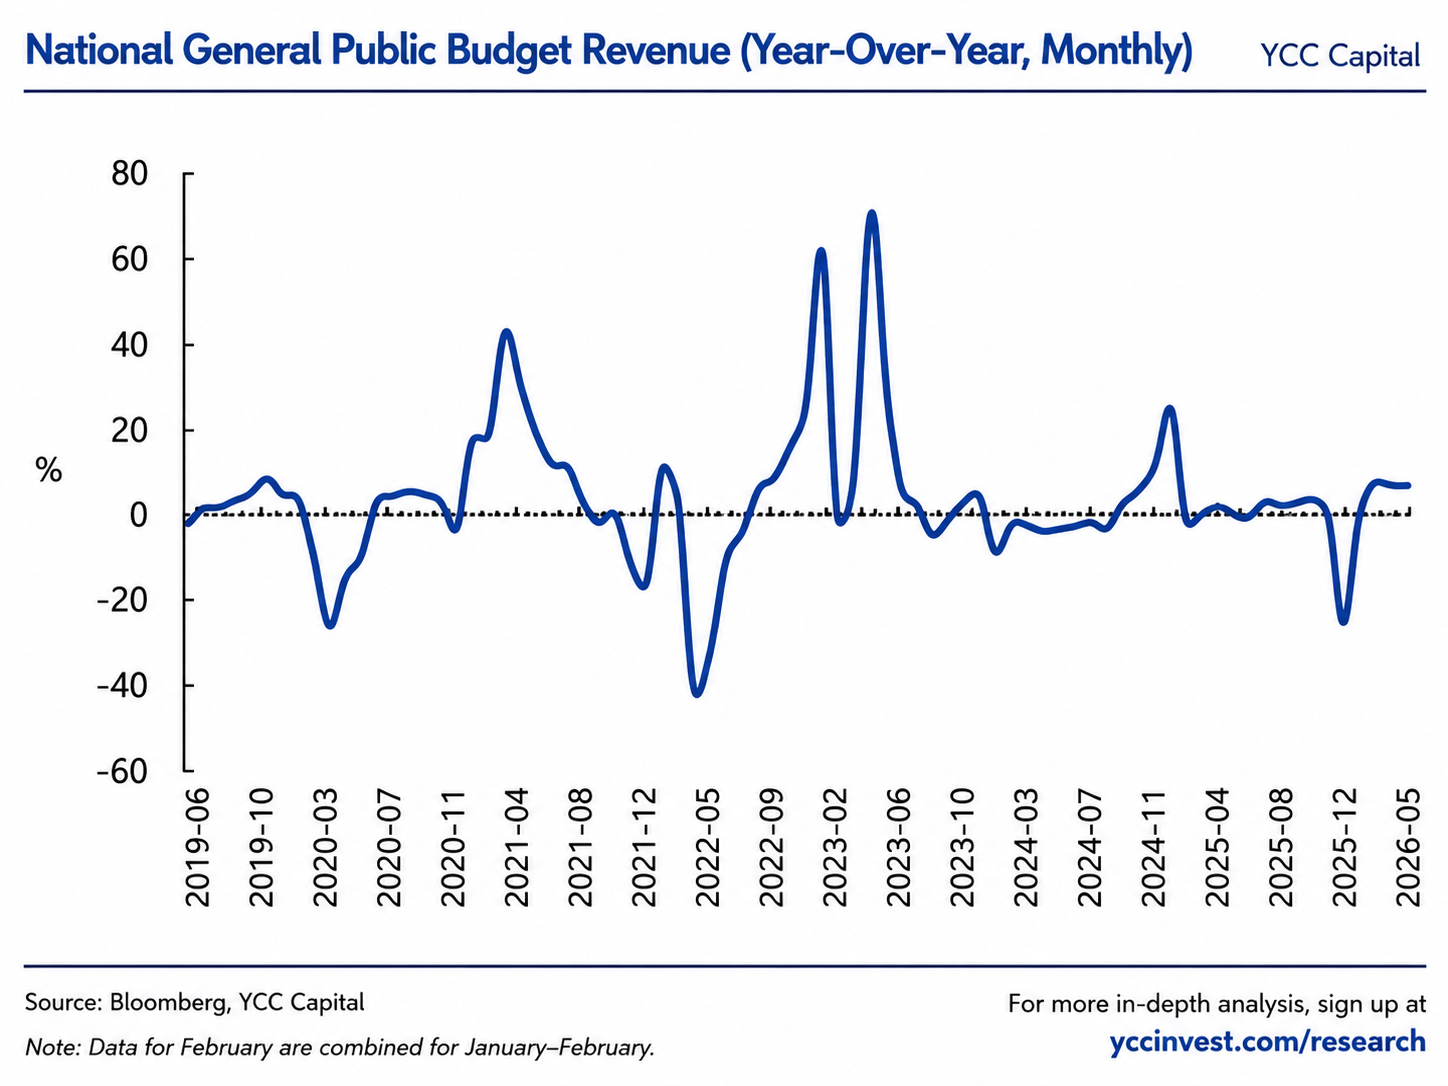
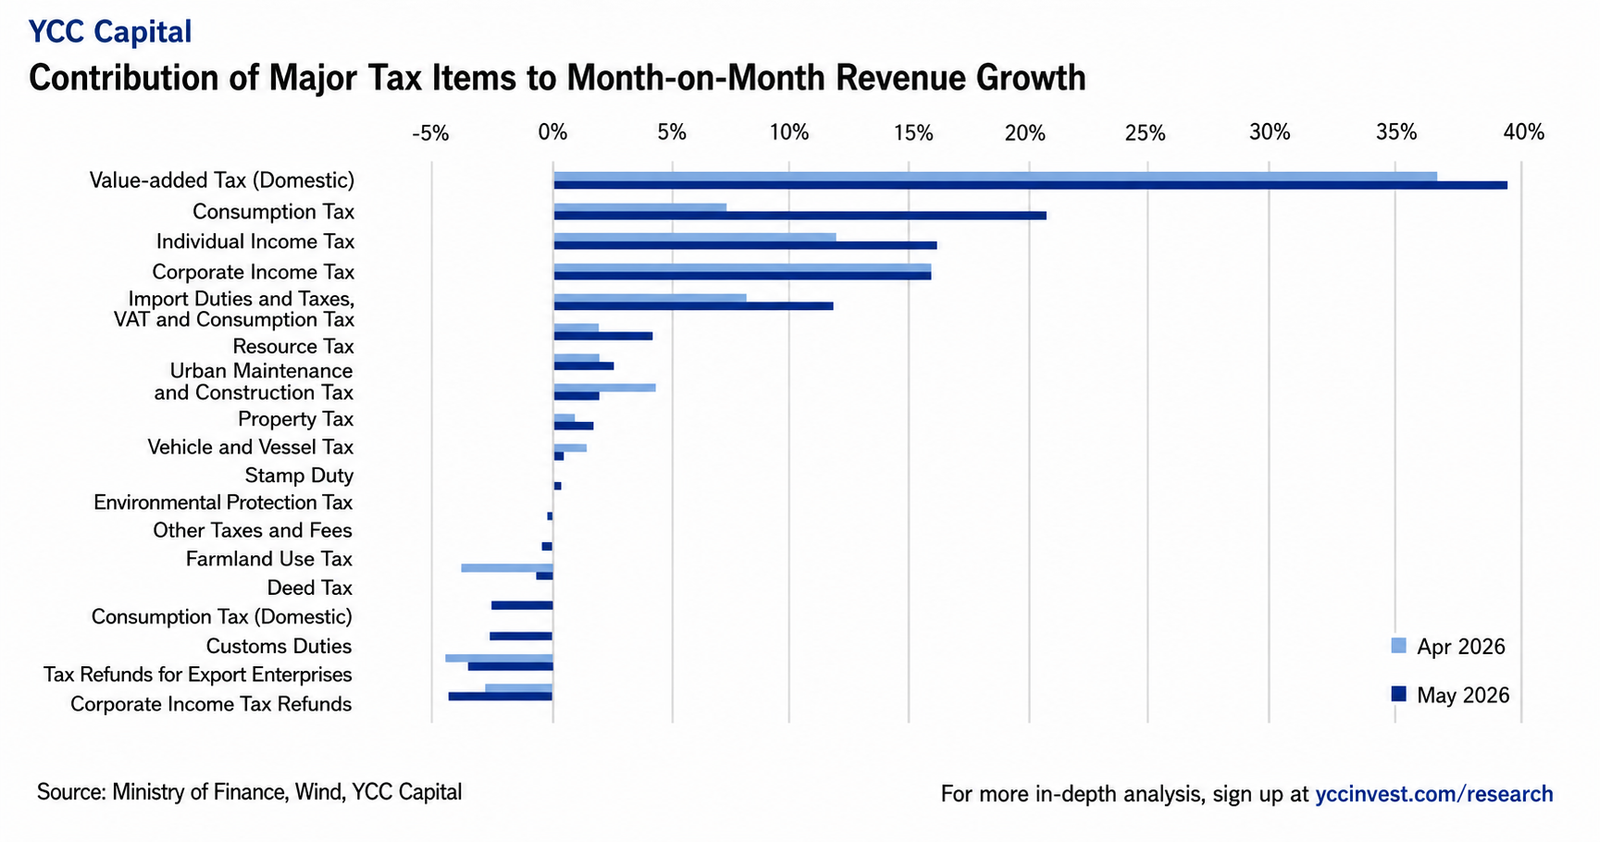
YCC CAPITAL Emerging Markets & China Strategy June 25, 2026 Executive Summary China’s January–May 2026 fiscal data reveal a government sector undergoing an important transition. After front-loading support earlier in the year, fiscal authorities appear to be moving into a temporary consolidation phase before a likely reacceleration in the second half. The key message is straightforward: fiscal revenues are recovering faster than expenditures. Government income has stabilized on the back of stronger industrial profitability, firmer producer prices, and more active capital markets. Meanwhile, spending growth has slowed considerably, suggesting policymakers are preserving ammunition for deployment later in the year. This pattern resembles a household that has already purchased the materials for a major renovation project but has not yet fully begun construction. The cash is available, the plans are largely approved, but the labor and execution phase has been deferred. For investors, the most important implication is that China’s fiscal impulse has not disappeared. Rather, it appears to have shifted into a later timetable. The combination of ultra-long special treasury bond issuance, special local government bond deployment, and policy-bank financing suggests fiscal support could strengthen during the third quarter. At the same time, structural constraints remain significant. Persistent weakness in land sales revenues continues to weigh on local government finances, highlighting the ongoing challenges facing China’s property sector and local fiscal architecture. From YCC Capital’s perspective, the data reinforce a broader theme: China continues to rely increasingly on state-led investment and fiscal engineering to offset structural weakness in private-sector demand and real estate. While cyclical stabilization is achievable, durable growth remains constrained by deeper balance-sheet pressures within households, developers, and local governments. Fiscal Revenue: Signs of Stabilization and Recovery Broad Fiscal Revenue Continues to Improve During January–May 2026, national general public budget revenue reached RMB 1.005 trillion, representing year-over-year growth of 4.0%. This marked an improvement from the January–April pace and signals a gradual recovery in government income generation. May alone generated fiscal revenue growth of 6.6% year-over-year, demonstrating continued momentum. Several factors supported this improvement: Better industrial profitability Higher producer price inflation Stronger manufacturing activity Increased activity in financial markets Improved tax collection dynamics Combined tax and non-tax revenues are now contributing to fiscal recovery, a notable improvement from earlier periods when tax receipts carried most of the burden. Tax Revenue Recovery Broadens Tax revenue totaled RMB 826.2 billion during the first five months of the year, increasing 4.4% year-over-year. The composition of this improvement offers valuable insight into the state of the economy. Value-Added Tax Remains Supportive Domestic VAT rose 6.2% year-over-year during January–May. In May alone, VAT increased 7.9%. Because VAT is closely tied to production and sales activity, the improvement suggests manufacturing conditions remain relatively resilient despite ongoing weakness in parts of the domestic economy. Producer prices also provided support. Higher industrial prices help expand taxable revenue bases even when real economic activity remains only moderately strong. Consumption Taxes Reflect Softer Consumer Demand Not all areas were equally positive. Domestic consumption tax revenue declined 3.1% year-over-year during the first five months. May consumption tax receipts fell 2.0% after previously recording positive growth. This slowdown is consistent with softer discretionary spending patterns, particularly in automobiles and consumer durables. The data reinforce a recurring theme in China’s economy: manufacturing activity has often outperformed household consumption, creating an increasingly unbalanced growth profile. Financial Markets Become an Important Revenue Source One of the strongest components of fiscal revenue came from capital markets. Stamp tax revenue increased 35.8% year-over-year. Even more striking, securities transaction stamp tax revenue surged 88.8% cumulatively and 145.9% in May alone. For fiscal authorities, active equity markets have become an increasingly important supplementary source of revenue. This dynamic illustrates an important feature of China’s policy framework. Healthy financial market activity not only supports investor confidence but also directly contributes to government revenue generation. Property-Related Taxes Remain Weak Despite some marginal improvement, real-estate-related taxes continue to reflect significant underlying weakness. During January–May: Deed tax revenue declined 14.8% Land value-added tax revenue declined 14.2% Although the pace of decline narrowed compared with previous months, the property sector remains a substantial drag on fiscal conditions. This is particularly important because land transactions have historically served as one of the most important funding channels for local governments. The gradual stabilization observed in recent months should not be mistaken for a recovery. Rather, it appears more consistent with a bottoming process characterized by low transaction volumes and cautious market sentiment. Corporate Profitability Shows Improvement One encouraging development emerged from corporate income taxes. Corporate income tax revenue turned positive on a cumulative basis for the first time this year, rising 0.2%. Monthly growth reached 3.3%. This improvement likely reflects: Stronger upstream commodity pricing Better profitability among advanced manufacturing industries Improved prepayments associated with recovering industrial profits However, the recovery remains uneven. Profit growth continues to be concentrated in select industries, while many traditional sectors face ongoing margin pressure. As a result, the sustainability of corporate tax improvement remains uncertain. Fiscal Expenditures: Deliberate Pause Before Potential Reacceleration Spending Growth Slows Significantly On the expenditure side, the picture differs considerably. National general public budget expenditures reached RMB 1.139 trillion during January–May, increasing only 0.8% year-over-year. This represented a further slowdown from earlier months. In May alone, spending fell 1.6% year-over-year, marking a second consecutive monthly contraction. The data suggest policymakers deliberately moderated fiscal deployment after strong first-quarter activity. Rather than continuously accelerating spending, authorities appear to be smoothing fiscal support over the course of the year. Central Government Supports Growth While Local Governments Lag The divergence between central and local government spending remains striking. In May: Central government expenditures rose 11.3% Local government expenditures fell 4.4% This gap reflects a broader structural reality. While Beijing maintains considerable fiscal flexibility, local governments remain constrained by: Weak land sales Elevated debt burdens Reduced financing capacity Slower property market activity The result is an increasingly centralized fiscal system in which the national government assumes a larger role in stabilization efforts. Spending Priorities Favor Technology and Social Welfare
China’s Fiscal Mirage: Tax Revenues Rebound, But Growth Engines Continue to Stall
YCC CAPITAL Emerging Markets & China Strategy ──────────────────────────────────────── June 23, 2026 Executive Summary China’s May 2026 fiscal data tells a familiar story: headline revenues are improving, yet underlying economic momentum remains fragile. Tax receipts strengthened, government revenues exceeded recent seasonal norms, and fiscal income quality improved as a larger share came from taxes rather than administrative or non-tax sources. However, beneath the surface, fiscal spending remained restrained, infrastructure-related expenditures continued to weaken, land-sale revenues deteriorated further, and special-purpose bond issuance lost momentum during the second quarter. For investors, the key takeaway is that China’s fiscal position is not constrained by a lack of funds as much as by a lack of effective transmission. Fiscal resources exist, but conversion into tangible economic activity remains slow. Much like a reservoir that appears full while irrigation channels remain clogged, capital is accumulating within the system without generating the growth impulse policymakers seek. From YCC Capital’s perspective, May’s data reinforces a broader theme that has defined China’s post-property-boom era: stabilization is possible, but sustainable acceleration remains elusive. Fiscal authorities are generating better revenues, yet the economy continues to struggle with weak private-sector confidence, sluggish property activity, and insufficient domestic demand. Sources: Bloomberg, YCC Capital (Based on China Ministry of Finance data discussed in the underlying report.) YCC Perspective Walking through many Chinese cities today reveals a striking contrast. Shopping malls remain crowded on weekends, restaurants are busy during holidays, and stock-market activity has recovered from previous lows. Yet conversations with business owners often tell a different story. Customers are more price-sensitive, investment decisions are postponed, and hiring remains cautious. China’s fiscal data reflects exactly this contradiction. Revenue collection has improved because industrial prices have stabilized and financial market activity has picked up. Yet spending, particularly spending that creates new economic activity, remains restrained. Revenue growth alone cannot generate stronger demand if government funds are not reaching projects, households, and businesses at a faster pace. The result is an economy that appears healthier on paper than it feels on the ground. Fiscal Revenue Improves as Tax Quality Strengthens Revenue Growth Remains Elevated China’s general public budget revenue increased 6.6% year-over-year in May, remaining near the strongest pace recorded so far this year. During the first five months of 2026, total fiscal revenue rose 4.0% year-over-year, with roughly 45.5% of the annual budget target already completed, a pace ahead of recent years. Importantly, the composition of revenue improved. Tax revenues rose 6.8% year-over-year in May, while cumulative tax revenue growth accelerated to 4.4%. Non-tax revenues grew 5.6%, with cumulative growth reaching 2.2%. Compared with the first quarter, a larger proportion of government income originated from traditional tax sources, indicating healthier revenue generation rather than dependence on one-off administrative measures. This matters because investors often focus solely on headline revenue growth. In reality, the source of revenue is equally important. Tax-driven growth generally reflects genuine economic activity, whereas non-tax revenues can often be temporary or policy-driven. In May, the “tax content” of fiscal revenue improved meaningfully. VAT and Financial Market Activity Drive Revenue Gains Two tax categories were responsible for most of the improvement: Value-Added Tax (VAT) Domestic VAT revenue increased 7.9% year-over-year in May, with cumulative growth rising to 6.2%. Improving industrial prices and earlier recovery in manufacturing production supported nominal sales and expanded the tax base. The improvement is particularly noteworthy because China has spent much of the past several years fighting industrial deflation. Even a modest recovery in upstream commodity and industrial prices can generate significant benefits for fiscal collections. Stamp Duties Stamp-duty revenue surged 109.8% year-over-year, while securities transaction stamp duties jumped 145.9%. Cumulative securities-related stamp duty growth reached nearly 89%, reflecting substantially stronger trading activity across China’s equity markets. The rebound aligns with elevated turnover across the Shanghai and Shenzhen exchanges during May. For policymakers, stronger stock-market activity serves multiple purposes. It boosts confidence, supports household wealth perceptions, and directly contributes to fiscal revenues. Consumption Taxes Signal Continuing Weakness Not all tax categories painted a positive picture. Consumption-tax revenue declined during May, consistent with weakness in automobile purchases and other large-ticket discretionary spending categories. Retail sales data during the same period similarly suggested that end-user demand remains subdued. This remains one of the central challenges facing China’s economy. While industrial production can be supported through policy initiatives and export demand, durable improvement ultimately requires stronger household consumption. The persistence of weak consumption-tax collections suggests Chinese households remain cautious despite numerous policy support measures. From a macro perspective, consumers continue to save more and spend less than policymakers would prefer. Spending Remains Restrained Despite Revenue Recovery Fiscal Expenditure Growth Remains Weak General public budget expenditures fell 1.6% year-over-year in May, although this represented an improvement from April’s 3.2% decline. Cumulative expenditure growth during January–May slowed to 0.8%, while only 37.95% of the annual spending budget had been executed. In other words, revenues are running ahead of schedule while spending remains behind schedule. This divergence is one of the most important messages within the May data release. Fiscal Pressure Concentrated at the Local Level The spending slowdown is largely a local-government phenomenon. Central government expenditures increased 11.3% year-over-year, while local-government spending declined 4.4%. This distinction matters because local governments are responsible for much of China’s infrastructure investment, public services, and economic implementation. Over the past decade, local governments served as China’s primary growth engine whenever economic momentum weakened. Today, however, they face significantly tighter financial conditions due to the prolonged property downturn and shrinking land-sale revenues. As a result, even when Beijing wishes to stimulate growth, implementation increasingly encounters local fiscal constraints. Social Spending Holds Up While Infrastructure Weakens Social Expenditures Continue to Provide Support China continues prioritizing social stability and household welfare. Combined expenditures on: Social security and employment Healthcare Education rose approximately 2.4% year-over-year in May. Cumulative growth remained a relatively healthy 4.7%, with social-security spending increasing 6.3% and healthcare spending increasing 11.3%. These figures reflect Beijing’s increasing emphasis on what policymakers call “investing in people” rather than relying exclusively on
China Housing’s Two-Speed Recovery: Why Premium and Distressed Assets Are Rebounding While the Middle Market Remains Trapped
YCC CAPITAL Emerging Markets & China Strategy Date: June 23, 2026 YCC Perspective A useful way to think about China’s housing market today is to imagine a city emerging from a long winter. The first signs of spring do not appear everywhere at once. The sunny hilltops thaw first, while the shaded valleys remain frozen. China’s property market is displaying a similar pattern. After several years of deep correction, the market is no longer moving as a single asset class. Instead, a pronounced bifurcation has emerged. On one end, low-priced, high-yield apartments are stabilizing as affordability improves. On the other, luxury properties in technology-driven cities are finding support from wealth effects tied to AI and capital markets. Between these two poles sits the broad middle market, which remains under pressure. The key question for investors is whether these divergences represent the beginning of a sustainable recovery or merely a temporary fragmentation within a still-challenging macro environment. Executive Summary China’s housing market is undergoing two important structural splits: A divergence between “Top-Tier” assets, “Bottom-Tier” assets, and the middle market Small, affordable apartments have been the first segment to stabilize. Luxury housing in technology-oriented cities such as Shenzhen has also begun recovering. Mid-market properties continue to face weak demand. A divergence between transaction prices and listing prices Listing prices continue to decline modestly. Actual transaction prices have largely stabilized and, in many cities, have begun recovering. The broader implication is that China’s property market may have entered a bottoming process rather than continuing a uniform decline. However, recovery remains highly uneven and heavily dependent on policy support, household confidence, and the ability of new economic sectors to offset weakness in traditional industries. The First Divergence: Luxury and Distressed Assets Outperform the Middle Market Affordable Housing Leads the Recovery The earliest stabilization has occurred in small apartments with low total purchase prices. These units generally offer: Higher rental yields Lower entry costs Stronger owner-occupier demand Less dependence on speculative investment After years of price declines, much of the financial speculation embedded in these assets has already been eliminated. What remains is housing’s consumption value—people buying homes because they need a place to live. In practical terms, many young families and first-time buyers are increasingly prioritizing affordability over prestige. Instead of stretching for larger apartments through leverage, buyers are choosing smaller homes and reducing mortgage exposure. This behavioral shift is becoming one of the defining characteristics of China’s post-bubble housing market. Luxury Housing Benefits from the AI Economy At the opposite end of the market, large luxury properties are also beginning to stabilize, particularly in cities with strong exposure to technology industries. Shenzhen stands out as the clearest example. Unlike affordable housing, luxury properties do not benefit from attractive rental yields. Their recovery is being driven by two different forces: 1. Falling Real Interest Rates for Technology Wealth The report highlights a growing divergence between AI-related industries and the broader economy. While much of China’s traditional industrial base continues to face pricing pressure, AI-linked sectors are experiencing strong growth. This creates a form of localized inflation among technology workers, entrepreneurs, and investors. As incomes and asset values rise within these sectors, the effective real cost of borrowing falls, making high-end property purchases more attractive. 2. Wealth Effects from Capital Markets Strong performance in technology-related equities and AI-linked businesses has supported income growth among a relatively small segment of the population. The beneficiaries include: Technology professionals Financial industry employees Entrepreneurs Equity holders This wealth effect is concentrated rather than broad-based, which explains why luxury housing recovery remains limited to a handful of cities rather than becoming a nationwide phenomenon. Why the Middle Market Is Struggling The recovery of low-end and high-end housing highlights a weakness in the middle segment. Households remain cautious toward leverage. Even when buyers maintain similar down payments, many are reducing mortgage sizes and purchasing cheaper homes than they would have considered previously. This means demand that once supported mid-priced properties is increasingly migrating toward lower-priced units. In effect, China’s housing recovery is not yet being driven by renewed confidence. It is being driven by selective affordability and selective wealth creation. That distinction matters. The Second Divergence: Transaction Prices vs. Listing Prices One of the most important developments is the growing gap between asking prices and actual transaction prices. Many observers continue focusing on listing prices, which remain under pressure. However, transaction prices tell a different story. According to the report: National transaction prices stabilized in April. Stabilization continued in May. An increasing number of cities have recorded positive month-over-month transaction price growth. Why This Matters Housing bottoms rarely occur when sellers become optimistic. They occur when distressed inventory gets absorbed. The current market appears to be experiencing exactly this process. Throughout early 2026, transaction volumes increased enough to gradually remove the most attractively priced inventory from the market. As these discounted properties disappear: Listing prices may continue falling. Negotiations may remain aggressive. Yet actual executed prices can still rise because buyers are purchasing increasingly higher-quality inventory. This dynamic is consistent with many historical housing recoveries globally. Transaction prices tend to bottom before public sentiment improves. Shenzhen: The Most Important Housing Market Signal Among China’s major cities, Shenzhen appears to be advancing furthest through the stabilization process. The report uses a leading indicator called the “up-down ratio,” which compares the number of communities raising asking prices versus those lowering them. Drawing comparisons with Hong Kong’s recent housing recovery: A ratio around 0.6 suggests a bottoming phase. Around 0.7 suggests stabilization. Above 0.8 suggests entry into a recovery phase. Shenzhen has approached the 0.8 threshold, placing it closest to a potential transition toward sustained recovery. Shanghai has also improved but appears less advanced. Beijing and Guangzhou remain in the earlier stages of stabilization. Lessons from Hong Kong The report draws extensive comparisons between mainland China and Hong Kong. Many conditions that preceded Hong Kong’s housing rebound are already present in mainland China: Deep price corrections Relaxation of housing restrictions Improving rental markets
China’s Recovery Is Losing Altitude: Exports Mask a Deepening Domestic Slowdown
YCC CAPITAL Emerging Markets & China Strategy June 23, 2026 Executive Summary China’s May economic data painted a picture of an economy becoming increasingly bifurcated. On the surface, headline growth metrics remain respectable, supported by strong exports and resilient industrial production. Beneath that surface, however, domestic demand continues to deteriorate. Investment contracted further, retail sales slipped into negative territory, and the property downturn remains firmly entrenched. The result is an economy increasingly dependent on external demand and policy-supported industrial activity while household confidence, private-sector investment, and real estate remain significant drags. From YCC Capital’s perspective, the most important takeaway is not that China is slowing dramatically, but that growth quality continues to weaken. The economy is generating output, yet struggling to generate sustainable domestic demand. Factories remain busy, but consumers remain cautious. Exporters are expanding, while households continue to retrench. The contrast increasingly resembles a household whose salary is still growing but whose spending keeps shrinking. The income statement looks healthy, but the underlying confidence is fading. China’s policy makers still possess considerable fiscal and monetary tools. However, unless policies succeed in restoring confidence among households and private businesses, cyclical stimulus alone is unlikely to generate a durable reacceleration. Key Themes Export growth remains exceptionally strong. Industrial production is benefiting from external demand and technology sectors. Fixed asset investment has deteriorated significantly. Consumer spending has turned negative. Real estate remains the largest structural drag on growth. Additional policy easing is likely if external demand weakens later this year. Source: Bloomberg, YCC Capital. The Big Picture: Two Economies Inside One China The dominant feature of China’s economy today is divergence. One economy is connected to global trade, advanced manufacturing, artificial intelligence infrastructure, semiconductors, and export-oriented production. This economy continues to perform relatively well. The other economy consists of households, property developers, local businesses, and private investors. This economy remains under considerable pressure. May data highlighted this divide more clearly than at any point this year. Two trends stand out: 1. External Strength vs. Domestic Weakness Exports accelerated sharply. Export growth surged from 14.1% in April to 19.4% in May, providing significant support to manufacturing activity and industrial production. At the same time: Fixed asset investment fell further into negative territory. Consumer spending contracted. Property activity remained deeply depressed. 2. Supply Strength vs. Demand Weakness Production accelerated while demand weakened. Factories continued to produce goods at a healthy pace, supported by exports and technology investment. Yet consumers and businesses showed little willingness to spend. This imbalance has become one of the defining characteristics of China’s post-pandemic economy. Source: Bloomberg, YCC Capital. Industrial Production: Exports Continue to Carry the Economy China’s industrial production rose 4.5% year-over-year in May, exceeding expectations and improving from April’s 4.1%. While the headline number appears encouraging, the drivers reveal a more nuanced story. Export Demand Remains the Primary Engine Industrial export deliveries increased 10.1% year-over-year in May. This marked the second consecutive month of double-digit growth. Global demand for Chinese manufactured goods has remained remarkably resilient despite geopolitical tensions and ongoing trade frictions. For many manufacturers, foreign customers continue to provide stronger demand than domestic buyers. Technology Manufacturing Accelerates High-tech manufacturing expanded 15.1% year-over-year, accelerating by 2.3 percentage points from April. Several factors are contributing: Global AI investment spending. Rising semiconductor exports. Domestic data center construction. Continued state support for strategic industries. China’s technology manufacturing complex remains one of the few areas enjoying simultaneous policy support, strong investment, and robust demand. Traditional Sectors Remain Mixed Performance varied across industries: Stronger sectors General equipment manufacturing Specialized equipment manufacturing Automobile production Weaker sectors Non-metallic minerals Certain commodity-processing industries Construction-linked sectors These patterns further reinforce the divergence between newer growth industries and traditional sectors tied to property development. Source: Bloomberg, YCC Capital. Fixed Asset Investment: A Significant Deterioration Perhaps the most concerning development in the May data was the continued collapse in investment activity. Urban fixed asset investment fell 4.1% year-over-year during the first five months of 2026. This represented a substantial deterioration from the previous reading of -1.6%. Private-sector investment declined 7.1%. Private investment often serves as one of the clearest indicators of business confidence. The continued decline suggests firms remain hesitant to commit capital despite government efforts to support growth. Source: Bloomberg, YCC Capital. Infrastructure Spending Loses Momentum Infrastructure investment growth slowed to just 0.6%. On a monthly basis, infrastructure investment is estimated to have contracted nearly 10%. Several factors contributed: Reduced urgency after a strong first quarter. Slower fiscal expenditure growth. Lower issuance of local government special bonds. Policy makers adopting a more patient stance amid strong exports. This appears more like a deliberate policy pause than a loss of capacity. China’s government retains significant control over infrastructure spending. As a result, infrastructure remains one of the most likely channels for future stimulus if growth weakens further. Looking ahead, YCC Capital expects infrastructure activity to improve during the second half of 2026 as projects associated with national strategic development plans accelerate. Source: Bloomberg, YCC Capital. Manufacturing Investment Turns Negative Manufacturing investment declined 0.4% year-over-year during January-May. This represents a meaningful shift from positive growth earlier in the year. Several forces appear to be at work. Rising Input Costs Producer prices have accelerated, particularly in upstream commodity sectors. Higher costs are causing many firms to delay expansion plans and reassess investment budgets. Capacity Rationalization Ongoing efforts to address excessive competition and industrial overcapacity are beginning to weigh on investment decisions. For example, automobile manufacturing investment declined 2.7%. AI and Technology Remain Bright Spots Not all manufacturing sectors are weakening. Investment linked to: AI infrastructure Semiconductors Advanced manufacturing Data centers continues to expand rapidly. In many respects, China is increasingly becoming a tale of two manufacturing sectors: traditional industries facing profitability pressure and advanced industries benefiting from structural policy support. Source: Bloomberg, YCC Capital. Real Estate: The Structural Problem Remains Unsolved The property market continues to be the single largest drag on China’s economy. Real estate investment fell 16.2% year-over-year through May. Monthly investment activity fell approximately 24.4%. These
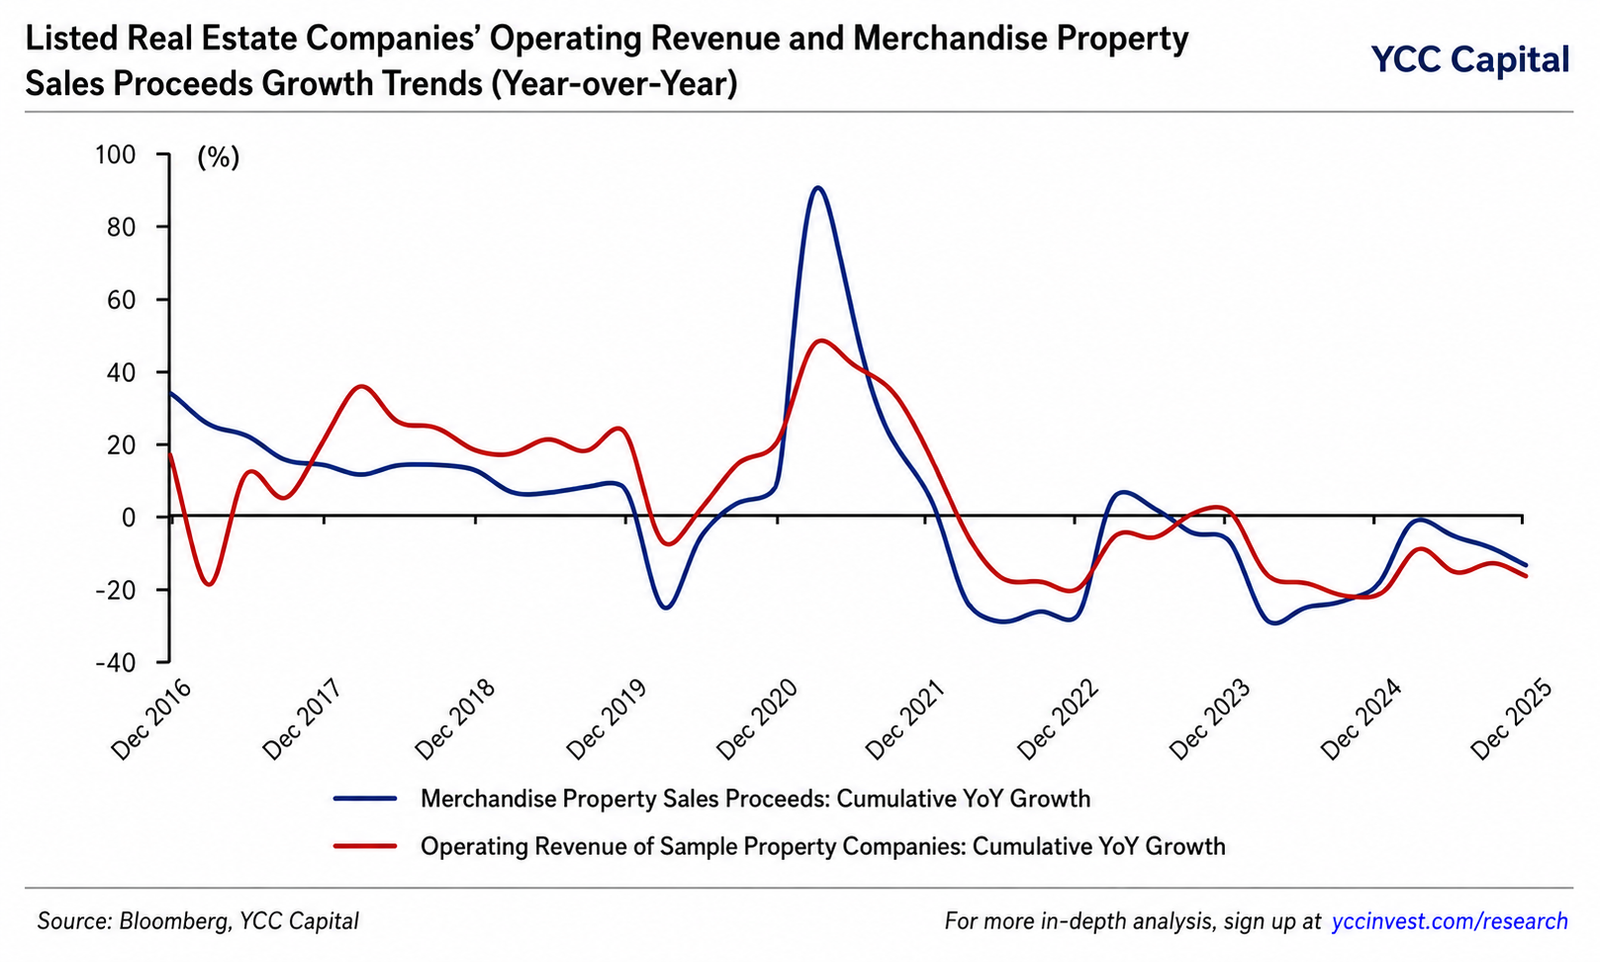
China Property Developers: The Long Bottoming Process — What 2025 Financial Statements Reveal About Real Estate Risk, Debt Repair, and the Road to Recovery
YCC CAPITAL Emerging Markets & China Strategy June 21, 2026 YCC Perspective For much of the past two decades, China’s property market functioned as both an economic engine and a household wealth creation machine. For many families, purchasing an apartment was not merely a housing decision—it was a milestone marking upward mobility, financial security, and participation in China’s growth story. Today, the industry finds itself in a very different phase. The question is no longer whether the sector is contracting. That adjustment is already well underway. The more important question is whether the industry is transitioning from a liquidity crisis toward a balance-sheet repair cycle that can ultimately restore sustainable growth. To answer that question, we examined the 2025 annual reports of 152 listed Chinese property developers across A-share and Hong Kong markets. The findings suggest that while systemic risks continue to decline and debt restructuring is making meaningful progress, operational fundamentals remain fragile. The industry is stabilizing—but it is not yet healthy. This report is based on financial data and analysis contained in the underlying industry research covering 152 listed Chinese developers. Executive Summary The central message from 2025 financial statements is straightforward: The Good News Industry leverage continues to decline. Debt restructuring has accelerated. Large-scale systemic financial risks are gradually easing. High-risk developers are reducing liabilities. Debt structures are becoming more long-term and standardized. The Bad News Revenue continues to fall. Profitability remains deeply impaired. Cash flow remains negative for a fifth consecutive year. Housing demand recovery remains uneven. Lower-tier cities continue to struggle with excess inventory. Private developers remain largely shut out of capital markets. In short, China’s property sector has moved from the acute phase of crisis into a prolonged phase of rehabilitation. The State of Developer Operations Sales Remain Weak Despite Signs of Stabilization 2025 marked another year of declining revenue for listed developers. Total revenue among the sample group reached approximately RMB 3.55 trillion, down 17.6% year-over-year. While this represented an improvement from the 21% decline recorded in 2024, the industry remains firmly within a downcycle. One of the most important indicators is contract liabilities—the pre-sold but not yet delivered housing inventory that represents future revenue. At year-end 2025: Contract liabilities fell to RMB 2.04 trillion. This represented a 31% annual decline. Coverage of future revenue dropped to only 0.57x, far below the 1.01x peak reached in 2022. This means developers are entering the next one to two years with a much thinner revenue pipeline. A useful analogy is a factory running on a shrinking order book. Even if production becomes more efficient, future output becomes constrained when incoming orders continue to decline. That is increasingly the challenge facing Chinese developers. Profitability Remains Under Severe Pressure Margins Continue to Deteriorate The industry’s gross margin fell to 11.8% in 2025, the lowest level on record. Two powerful forces continue to compress profitability: 1. Weak Pricing Power Developers remain heavily reliant on discounts and promotional campaigns to generate cash flow. 2. Legacy High-Cost Land Banks Projects acquired during the boom years continue to enter delivery phases. These projects were purchased at much higher land costs than current market conditions justify. As a result: Selling prices fall. Construction costs remain elevated. Margins get squeezed from both directions. Losses Remain Widespread More than 60% of listed developers reported net losses in 2025. Asset impairments remain a major factor. Developers continue to write down: Land reserves Unsold inventory Investment properties Commercial assets The result is an industry still deeply challenged at the operational level. Why Reported Losses Improved At first glance, the numbers appear encouraging. Industry net losses narrowed by approximately RMB 156 billion in 2025. However, this improvement largely reflects debt restructuring gains rather than stronger business performance. Developers undergoing restructuring recorded significant non-recurring gains. Industry-wide non-recurring income reached roughly RMB 456 billion, the highest level on record. Without these restructuring benefits: Net losses would actually have widened. Underlying profitability remains deeply negative. The distinction matters. A company can appear healthier because its debts were renegotiated, even while its core business continues to struggle. Inventory: Falling, But For the Wrong Reasons Inventory declined significantly during 2025. Total inventory fell 15.7% year-over-year. At first glance this sounds positive. However, much of the reduction came from write-downs and impairments rather than successful sales. Developers have increasingly chosen to recognize losses and reduce the book value of assets rather than wait indefinitely for market conditions to improve. Inventory turnover remained largely unchanged: Inventory turnover period remained roughly 36 months. This suggests the actual pace of inventory absorption remains slow. The divide between cities is also becoming more pronounced: Stronger Markets Beijing Shanghai Shenzhen Core Tier-2 cities Weaker Markets Tier-3 cities Tier-4 cities Population outflow regions Inventory pressure remains concentrated in weaker local markets. Cash Flow: The Industry’s Core Challenge If one metric captures the industry’s condition, it is cash flow. The sector recorded negative aggregate cash flow for a fifth consecutive year. Net cash flow reached approximately: –RMB 177 billion More than 70% of developers reported negative net cash flow. Operating Cash Flow Operating cash flow remained broadly stable because developers adopted what could be described as a “sell less, spend less” model. As sales declined: Construction activity slowed. Procurement spending declined. New project commitments were reduced. This kept operating cash flow from deteriorating further, but it also reinforced industry contraction. Investment Activity Investment cash outflows increased modestly. Interestingly, stronger state-backed developers continued selectively purchasing land in prime cities. This reflects a growing divergence: Strong firms are becoming stronger. Weak firms continue shrinking. Financing Remains the Biggest Constraint Financing cash flow remains deeply negative. Despite government support programs and financing coordination mechanisms, developers continue to repay more debt than they can raise. Financing cash outflows reached nearly RMB 476 billion in 2025. This remains the single largest obstacle preventing a stronger recovery. Growing Industry Polarization One of the clearest themes emerging from 2025 data is increasing concentration. State-owned and centrally controlled developers continue gaining market share. Revenue Performance 2025 revenue: